Zip Codes with the Highest Percentage of Self-Employed / Incorporated in San Antonio, TX
RELATED REPORTS & OPTIONS
Self-Employed / Incorporated
San Antonio
Compare Zip Codes
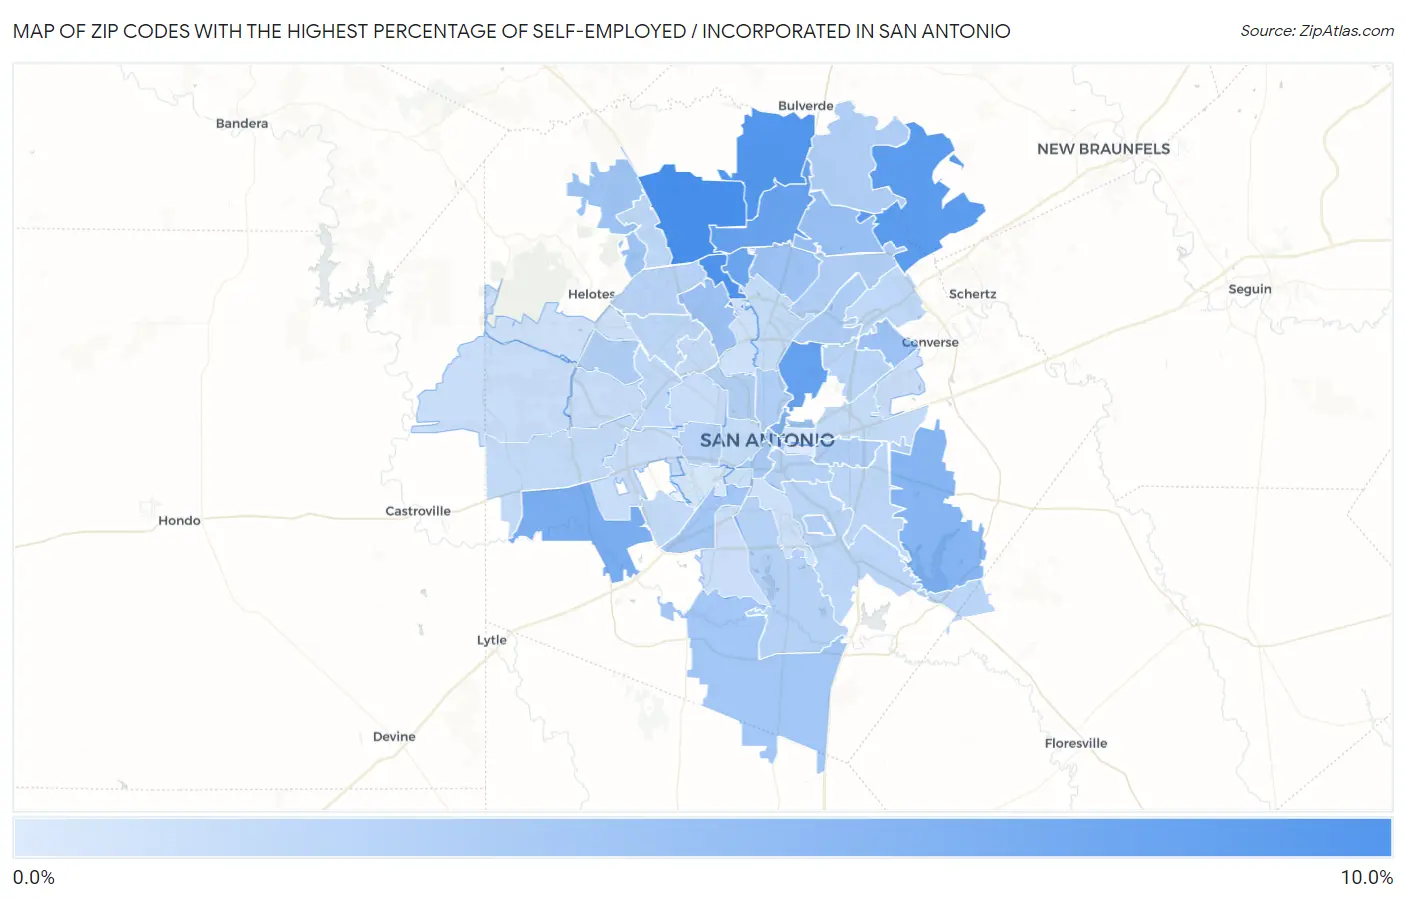
Map of Zip Codes with the Highest Percentage of Self-Employed / Incorporated in San Antonio
0.36%
9.4%
Zip Codes with the Highest Percentage of Self-Employed / Incorporated in San Antonio, TX
| Zip Code | % Self-Employed / Incorporated | vs State | vs National | |
| 1. | 78257 | 9.4% | 3.4%(+6.02)#98 | 3.8%(+5.57)#2,645 |
| 2. | 78231 | 8.8% | 3.4%(+5.41)#115 | 3.8%(+4.96)#3,026 |
| 3. | 78260 | 8.7% | 3.4%(+5.35)#116 | 3.8%(+4.91)#3,066 |
| 4. | 78266 | 8.2% | 3.4%(+4.85)#131 | 3.8%(+4.40)#3,461 |
| 5. | 78209 | 7.6% | 3.4%(+4.21)#158 | 3.8%(+3.76)#4,090 |
| 6. | 78258 | 7.3% | 3.4%(+3.98)#175 | 3.8%(+3.53)#4,336 |
| 7. | 78248 | 7.1% | 3.4%(+3.77)#181 | 3.8%(+3.32)#4,590 |
| 8. | 78252 | 6.3% | 3.4%(+2.88)#232 | 3.8%(+2.43)#5,880 |
| 9. | 78215 | 5.9% | 3.4%(+2.52)#257 | 3.8%(+2.07)#6,547 |
| 10. | 78263 | 5.5% | 3.4%(+2.15)#297 | 3.8%(+1.70)#7,307 |
| 11. | 78259 | 4.5% | 3.4%(+1.09)#457 | 3.8%(+0.643)#10,229 |
| 12. | 78208 | 4.4% | 3.4%(+0.991)#478 | 3.8%(+0.542)#10,593 |
| 13. | 78239 | 4.3% | 3.4%(+0.979)#480 | 3.8%(+0.530)#10,642 |
| 14. | 78230 | 4.3% | 3.4%(+0.972)#485 | 3.8%(+0.523)#10,666 |
| 15. | 78232 | 4.2% | 3.4%(+0.874)#503 | 3.8%(+0.425)#11,029 |
| 16. | 78255 | 4.1% | 3.4%(+0.710)#528 | 3.8%(+0.261)#11,609 |
| 17. | 78264 | 3.8% | 3.4%(+0.408)#595 | 3.8%(-0.041)#12,855 |
| 18. | 78211 | 3.7% | 3.4%(+0.331)#616 | 3.8%(-0.118)#13,197 |
| 19. | 78204 | 3.4% | 3.4%(+0.033)#691 | 3.8%(-0.416)#14,490 |
| 20. | 78205 | 3.4% | 3.4%(+0.007)#698 | 3.8%(-0.442)#14,613 |
| 21. | 78217 | 3.2% | 3.4%(-0.163)#745 | 3.8%(-0.612)#15,380 |
| 22. | 78220 | 3.0% | 3.4%(-0.331)#807 | 3.8%(-0.780)#16,198 |
| 23. | 78261 | 3.0% | 3.4%(-0.356)#813 | 3.8%(-0.805)#16,322 |
| 24. | 78247 | 3.0% | 3.4%(-0.358)#814 | 3.8%(-0.807)#16,332 |
| 25. | 78235 | 2.9% | 3.4%(-0.420)#837 | 3.8%(-0.869)#16,654 |
| 26. | 78212 | 2.9% | 3.4%(-0.487)#865 | 3.8%(-0.936)#16,986 |
| 27. | 78250 | 2.9% | 3.4%(-0.503)#867 | 3.8%(-0.952)#17,064 |
| 28. | 78201 | 2.7% | 3.4%(-0.625)#901 | 3.8%(-1.07)#17,647 |
| 29. | 78221 | 2.6% | 3.4%(-0.747)#952 | 3.8%(-1.20)#18,333 |
| 30. | 78210 | 2.6% | 3.4%(-0.779)#959 | 3.8%(-1.23)#18,476 |
| 31. | 78237 | 2.5% | 3.4%(-0.863)#982 | 3.8%(-1.31)#18,866 |
| 32. | 78249 | 2.5% | 3.4%(-0.883)#986 | 3.8%(-1.33)#18,967 |
| 33. | 78218 | 2.4% | 3.4%(-0.941)#1,008 | 3.8%(-1.39)#19,270 |
| 34. | 78223 | 2.4% | 3.4%(-0.949)#1,013 | 3.8%(-1.40)#19,309 |
| 35. | 78222 | 2.2% | 3.4%(-1.17)#1,071 | 3.8%(-1.62)#20,378 |
| 36. | 78240 | 2.2% | 3.4%(-1.19)#1,080 | 3.8%(-1.64)#20,504 |
| 37. | 78233 | 2.2% | 3.4%(-1.20)#1,086 | 3.8%(-1.65)#20,544 |
| 38. | 78238 | 2.2% | 3.4%(-1.21)#1,088 | 3.8%(-1.66)#20,587 |
| 39. | 78256 | 2.1% | 3.4%(-1.27)#1,113 | 3.8%(-1.72)#20,904 |
| 40. | 78245 | 1.9% | 3.4%(-1.49)#1,177 | 3.8%(-1.93)#21,910 |
| 41. | 78229 | 1.9% | 3.4%(-1.50)#1,182 | 3.8%(-1.95)#21,992 |
| 42. | 78242 | 1.8% | 3.4%(-1.53)#1,192 | 3.8%(-1.98)#22,135 |
| 43. | 78219 | 1.8% | 3.4%(-1.56)#1,202 | 3.8%(-2.01)#22,257 |
| 44. | 78216 | 1.7% | 3.4%(-1.64)#1,221 | 3.8%(-2.09)#22,557 |
| 45. | 78207 | 1.7% | 3.4%(-1.71)#1,247 | 3.8%(-2.16)#22,855 |
| 46. | 78251 | 1.6% | 3.4%(-1.77)#1,267 | 3.8%(-2.22)#23,110 |
| 47. | 78228 | 1.6% | 3.4%(-1.79)#1,277 | 3.8%(-2.23)#23,169 |
| 48. | 78244 | 1.5% | 3.4%(-1.83)#1,292 | 3.8%(-2.28)#23,345 |
| 49. | 78227 | 1.5% | 3.4%(-1.86)#1,306 | 3.8%(-2.31)#23,455 |
| 50. | 78253 | 1.5% | 3.4%(-1.86)#1,308 | 3.8%(-2.31)#23,466 |
| 51. | 78225 | 1.5% | 3.4%(-1.88)#1,312 | 3.8%(-2.32)#23,508 |
| 52. | 78224 | 1.4% | 3.4%(-1.97)#1,335 | 3.8%(-2.42)#23,874 |
| 53. | 78254 | 1.2% | 3.4%(-2.15)#1,384 | 3.8%(-2.60)#24,557 |
| 54. | 78213 | 1.2% | 3.4%(-2.19)#1,391 | 3.8%(-2.64)#24,713 |
| 55. | 78214 | 1.1% | 3.4%(-2.22)#1,397 | 3.8%(-2.67)#24,828 |
| 56. | 78202 | 0.83% | 3.4%(-2.54)#1,466 | 3.8%(-2.99)#25,746 |
| 57. | 78226 | 0.82% | 3.4%(-2.55)#1,468 | 3.8%(-3.00)#25,755 |
| 58. | 78203 | 0.36% | 3.4%(-3.01)#1,536 | 3.8%(-3.46)#26,711 |
1
Common Questions
What are the Top 10 Zip Codes with the Highest Percentage of Self-Employed / Incorporated in San Antonio, TX?
Top 10 Zip Codes with the Highest Percentage of Self-Employed / Incorporated in San Antonio, TX are:
What zip code has the Highest Percentage of Self-Employed / Incorporated in San Antonio, TX?
78257 has the Highest Percentage of Self-Employed / Incorporated in San Antonio, TX with 9.4%.
What is the Percentage of Self-Employed / Incorporated in San Antonio, TX?
Percentage of Self-Employed / Incorporated in San Antonio is 2.7%.
What is the Percentage of Self-Employed / Incorporated in Texas?
Percentage of Self-Employed / Incorporated in Texas is 3.4%.
What is the Percentage of Self-Employed / Incorporated in the United States?
Percentage of Self-Employed / Incorporated in the United States is 3.8%.