Zip Codes with the Highest Percentage of Renter-Occupied Units in San Antonio, TX
RELATED REPORTS & OPTIONS
Highest Renter-Occupied
San Antonio
Compare Zip Codes
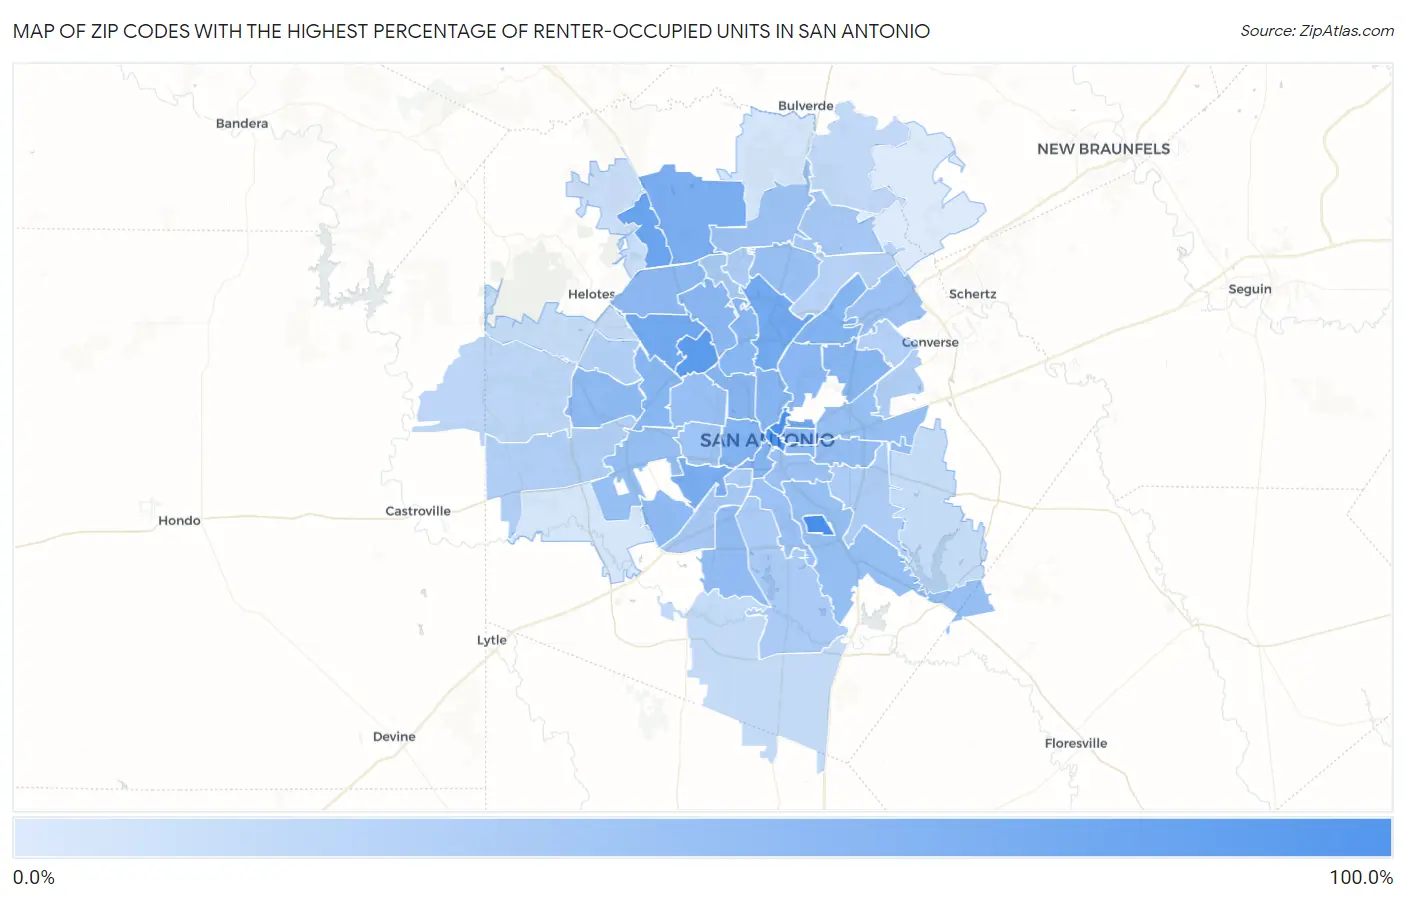
Map of Zip Codes with the Highest Percentage of Renter-Occupied Units in San Antonio
0.0%
100.0%
Zip Codes with the Highest Percentage of Renter-Occupied Units in San Antonio, TX
| Zip Code | % Renter-Occupied | vs State | vs National | |
| 1. | 78235 | 100.0% | 37.6%(+62.4)#4 | 35.2%(+64.8)#57 |
| 2. | 78215 | 95.6% | 37.6%(+58.0)#29 | 35.2%(+60.4)#378 |
| 3. | 78205 | 92.1% | 37.6%(+54.5)#36 | 35.2%(+57.0)#424 |
| 4. | 78229 | 85.3% | 37.6%(+47.7)#47 | 35.2%(+50.2)#546 |
| 5. | 78256 | 71.2% | 37.6%(+33.6)#88 | 35.2%(+36.0)#1,001 |
| 6. | 78208 | 66.3% | 37.6%(+28.7)#112 | 35.2%(+31.2)#1,282 |
| 7. | 78216 | 66.3% | 37.6%(+28.7)#114 | 35.2%(+31.1)#1,289 |
| 8. | 78240 | 65.7% | 37.6%(+28.1)#116 | 35.2%(+30.5)#1,327 |
| 9. | 78226 | 61.3% | 37.6%(+23.7)#145 | 35.2%(+26.1)#1,692 |
| 10. | 78257 | 61.3% | 37.6%(+23.6)#146 | 35.2%(+26.1)#1,695 |
| 11. | 78207 | 56.3% | 37.6%(+18.7)#181 | 35.2%(+21.1)#2,174 |
| 12. | 78217 | 55.6% | 37.6%(+18.0)#185 | 35.2%(+20.4)#2,251 |
| 13. | 78204 | 55.2% | 37.6%(+17.6)#189 | 35.2%(+20.0)#2,310 |
| 14. | 78212 | 54.1% | 37.6%(+16.5)#196 | 35.2%(+18.9)#2,453 |
| 15. | 78213 | 53.3% | 37.6%(+15.7)#206 | 35.2%(+18.1)#2,571 |
| 16. | 78238 | 52.5% | 37.6%(+14.9)#217 | 35.2%(+17.3)#2,705 |
| 17. | 78218 | 52.3% | 37.6%(+14.7)#218 | 35.2%(+17.2)#2,721 |
| 18. | 78201 | 52.2% | 37.6%(+14.6)#220 | 35.2%(+17.0)#2,739 |
| 19. | 78209 | 51.7% | 37.6%(+14.1)#225 | 35.2%(+16.5)#2,812 |
| 20. | 78230 | 51.0% | 37.6%(+13.4)#234 | 35.2%(+15.9)#2,928 |
| 21. | 78203 | 51.0% | 37.6%(+13.3)#235 | 35.2%(+15.8)#2,944 |
| 22. | 78202 | 50.0% | 37.6%(+12.4)#249 | 35.2%(+14.8)#3,098 |
| 23. | 78249 | 49.6% | 37.6%(+12.0)#257 | 35.2%(+14.4)#3,161 |
| 24. | 78242 | 48.2% | 37.6%(+10.6)#281 | 35.2%(+13.0)#3,404 |
| 25. | 78251 | 48.2% | 37.6%(+10.6)#282 | 35.2%(+13.0)#3,405 |
| 26. | 78224 | 46.5% | 37.6%(+8.92)#314 | 35.2%(+11.3)#3,728 |
| 27. | 78220 | 45.1% | 37.6%(+7.49)#340 | 35.2%(+9.91)#4,033 |
| 28. | 78219 | 43.9% | 37.6%(+6.27)#359 | 35.2%(+8.69)#4,351 |
| 29. | 78223 | 43.8% | 37.6%(+6.18)#362 | 35.2%(+8.60)#4,367 |
| 30. | 78227 | 43.6% | 37.6%(+6.00)#368 | 35.2%(+8.42)#4,417 |
| 31. | 78232 | 42.9% | 37.6%(+5.32)#389 | 35.2%(+7.74)#4,593 |
| 32. | 78228 | 42.1% | 37.6%(+4.47)#400 | 35.2%(+6.89)#4,816 |
| 33. | 78210 | 41.9% | 37.6%(+4.31)#406 | 35.2%(+6.73)#4,864 |
| 34. | 78214 | 41.1% | 37.6%(+3.46)#427 | 35.2%(+5.88)#5,086 |
| 35. | 78258 | 40.7% | 37.6%(+3.14)#435 | 35.2%(+5.56)#5,187 |
| 36. | 78233 | 39.7% | 37.6%(+2.05)#462 | 35.2%(+4.47)#5,512 |
| 37. | 78237 | 38.0% | 37.6%(+0.434)#505 | 35.2%(+2.85)#6,079 |
| 38. | 78211 | 35.0% | 37.6%(-2.59)#580 | 35.2%(-0.174)#7,347 |
| 39. | 78259 | 34.6% | 37.6%(-3.05)#601 | 35.2%(-0.631)#7,585 |
| 40. | 78231 | 33.1% | 37.6%(-4.54)#654 | 35.2%(-2.12)#8,289 |
| 41. | 78221 | 32.1% | 37.6%(-5.46)#679 | 35.2%(-3.04)#8,767 |
| 42. | 78225 | 31.9% | 37.6%(-5.68)#688 | 35.2%(-3.26)#8,903 |
| 43. | 78222 | 30.7% | 37.6%(-6.86)#728 | 35.2%(-4.44)#9,607 |
| 44. | 78248 | 30.3% | 37.6%(-7.31)#754 | 35.2%(-4.89)#9,874 |
| 45. | 78244 | 29.5% | 37.6%(-8.09)#792 | 35.2%(-5.67)#10,388 |
| 46. | 78245 | 27.7% | 37.6%(-9.86)#860 | 35.2%(-7.44)#11,573 |
| 47. | 78239 | 27.5% | 37.6%(-10.2)#875 | 35.2%(-7.73)#11,782 |
| 48. | 78250 | 26.7% | 37.6%(-10.9)#902 | 35.2%(-8.47)#12,298 |
| 49. | 78247 | 24.6% | 37.6%(-13.0)#1,001 | 35.2%(-10.5)#13,953 |
| 50. | 78253 | 21.8% | 37.6%(-15.8)#1,152 | 35.2%(-13.4)#16,540 |
| 51. | 78261 | 20.1% | 37.6%(-17.5)#1,232 | 35.2%(-15.1)#18,126 |
| 52. | 78264 | 18.2% | 37.6%(-19.4)#1,314 | 35.2%(-16.9)#19,923 |
| 53. | 78254 | 17.8% | 37.6%(-19.8)#1,342 | 35.2%(-17.4)#20,398 |
| 54. | 78263 | 17.4% | 37.6%(-20.2)#1,365 | 35.2%(-17.8)#20,792 |
| 55. | 78255 | 15.8% | 37.6%(-21.8)#1,443 | 35.2%(-19.4)#22,380 |
| 56. | 78260 | 11.5% | 37.6%(-26.1)#1,606 | 35.2%(-23.7)#26,214 |
| 57. | 78252 | 10.3% | 37.6%(-27.3)#1,652 | 35.2%(-24.9)#27,111 |
| 58. | 78266 | 6.8% | 37.6%(-30.8)#1,737 | 35.2%(-28.4)#29,302 |
1
Common Questions
What are the Top 10 Zip Codes with the Highest Percentage of Renter-Occupied Units in San Antonio, TX?
Top 10 Zip Codes with the Highest Percentage of Renter-Occupied Units in San Antonio, TX are:
What zip code has the Highest Percentage of Renter-Occupied Units in San Antonio, TX?
78235 has the Highest Percentage of Renter-Occupied Units in San Antonio, TX with 100.0%.
What is the Percentage of Renter-Occupied Units in San Antonio, TX?
Percentage of Renter-Occupied Units in San Antonio is 48.1%.
What is the Percentage of Renter-Occupied Units in Texas?
Percentage of Renter-Occupied Units in Texas is 37.6%.
What is the Percentage of Renter-Occupied Units in the United States?
Percentage of Renter-Occupied Units in the United States is 35.2%.