Zip Codes with the Highest Percentage of Population Employed in Sales & Related in Rule, TX
RELATED REPORTS & OPTIONS
Sales & Related
Rule
Compare Zip Codes
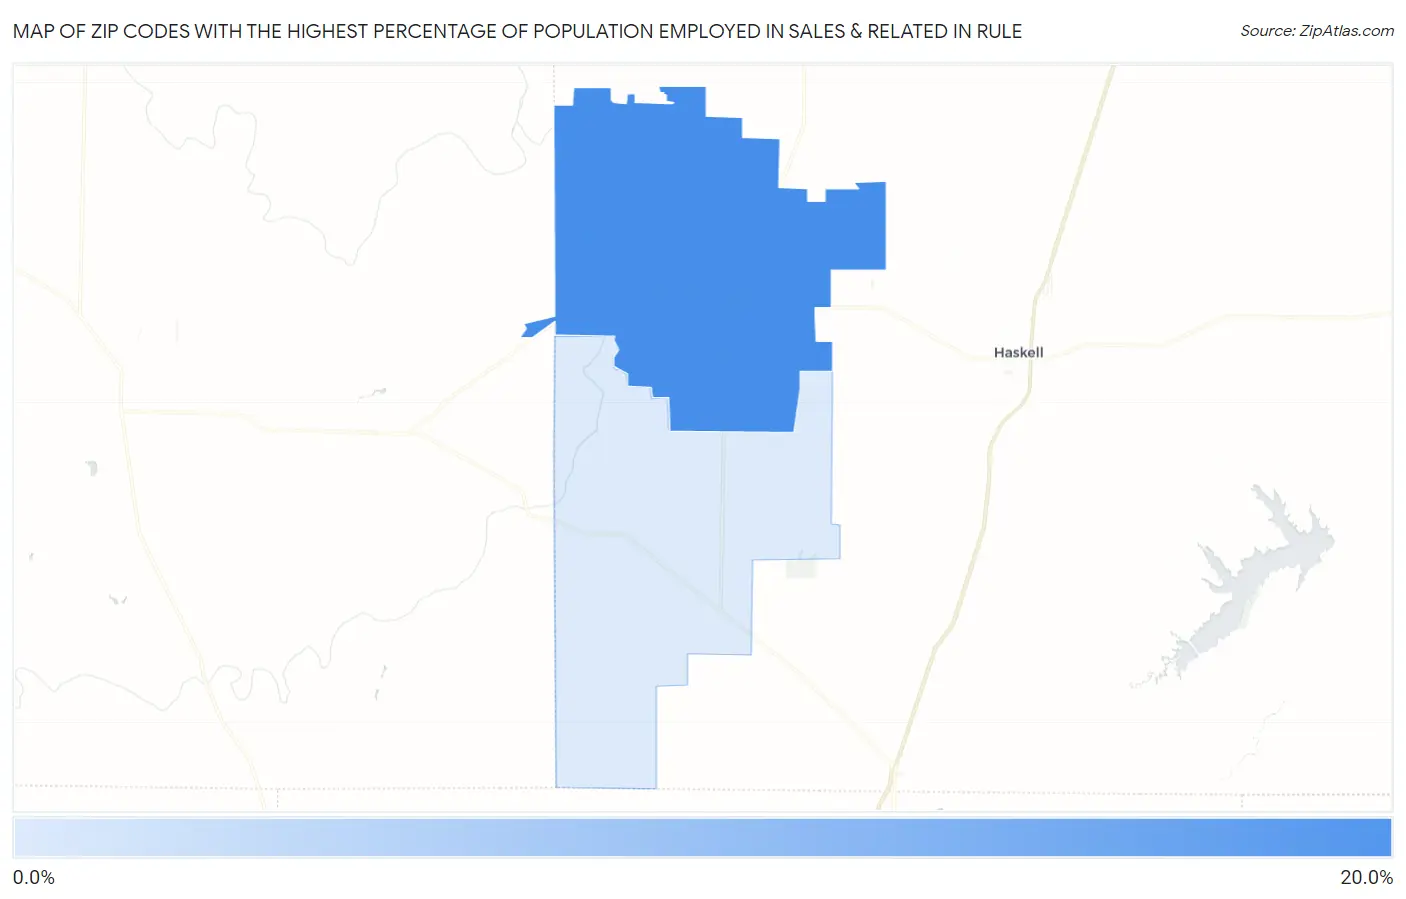
Map of Zip Codes with the Highest Percentage of Population Employed in Sales & Related in Rule
2.6%
19.1%
Zip Codes with the Highest Percentage of Population Employed in Sales & Related in Rule, TX
| Zip Code | % Employed | vs State | vs National | |
| 1. | 79547 | 19.1% | 10.2%(+8.90)#80 | 9.6%(+9.53)#1,315 |
| 2. | 79548 | 2.6% | 10.2%(-7.66)#1,674 | 9.6%(-7.03)#28,538 |
1
Common Questions
What are the Top Zip Codes with the Highest Percentage of Population Employed in Sales & Related in Rule, TX?
Top Zip Codes with the Highest Percentage of Population Employed in Sales & Related in Rule, TX are:
What zip code has the Highest Percentage of Population Employed in Sales & Related in Rule, TX?
79547 has the Highest Percentage of Population Employed in Sales & Related in Rule, TX with 19.1%.
What is the Percentage of Population Employed in Sales & Related in Rule, TX?
Percentage of Population Employed in Sales & Related in Rule is 21.2%.
What is the Percentage of Population Employed in Sales & Related in Texas?
Percentage of Population Employed in Sales & Related in Texas is 10.2%.
What is the Percentage of Population Employed in Sales & Related in the United States?
Percentage of Population Employed in Sales & Related in the United States is 9.6%.