Zip Codes with the Highest Percentage of Population Employed in Agriculture, Fishing & Hunting in Pearland, TX
RELATED REPORTS & OPTIONS
Agriculture, Fishing & Hunting
Pearland
Compare Zip Codes
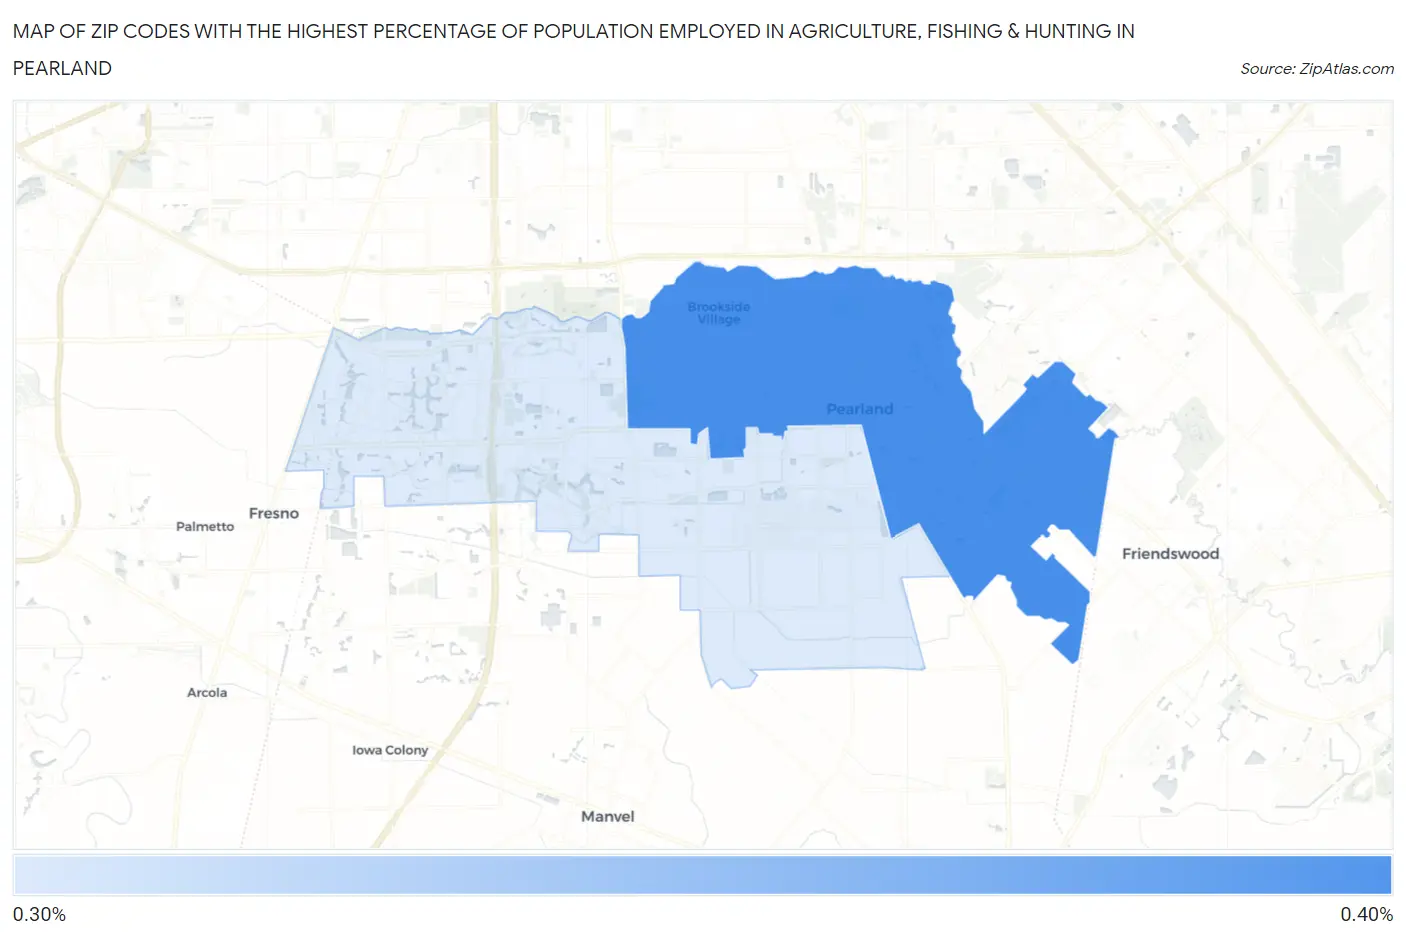
Map of Zip Codes with the Highest Percentage of Population Employed in Agriculture, Fishing & Hunting in Pearland
0.0%
0.40%
Zip Codes with the Highest Percentage of Population Employed in Agriculture, Fishing & Hunting in Pearland, TX
| Zip Code | % Employed | vs State | vs National | |
| 1. | 77581 | 0.32% | 0.75%(-0.430)#1,142 | 1.2%(-0.878)#20,934 |
| 2. | 77584 | 0.30% | 0.75%(-0.449)#1,153 | 1.2%(-0.897)#21,138 |
1
Common Questions
What are the Top Zip Codes with the Highest Percentage of Population Employed in Agriculture, Fishing & Hunting in Pearland, TX?
Top Zip Codes with the Highest Percentage of Population Employed in Agriculture, Fishing & Hunting in Pearland, TX are:
What zip code has the Highest Percentage of Population Employed in Agriculture, Fishing & Hunting in Pearland, TX?
77581 has the Highest Percentage of Population Employed in Agriculture, Fishing & Hunting in Pearland, TX with 0.32%.
What is the Percentage of Population Employed in Agriculture, Fishing & Hunting in Pearland, TX?
Percentage of Population Employed in Agriculture, Fishing & Hunting in Pearland is 0.34%.
What is the Percentage of Population Employed in Agriculture, Fishing & Hunting in Texas?
Percentage of Population Employed in Agriculture, Fishing & Hunting in Texas is 0.75%.
What is the Percentage of Population Employed in Agriculture, Fishing & Hunting in the United States?
Percentage of Population Employed in Agriculture, Fishing & Hunting in the United States is 1.2%.