Zip Codes with the Highest Percentage of Population Employed in Agriculture, Fishing & Hunting in Orange, TX
RELATED REPORTS & OPTIONS
Agriculture, Fishing & Hunting
Orange
Compare Zip Codes
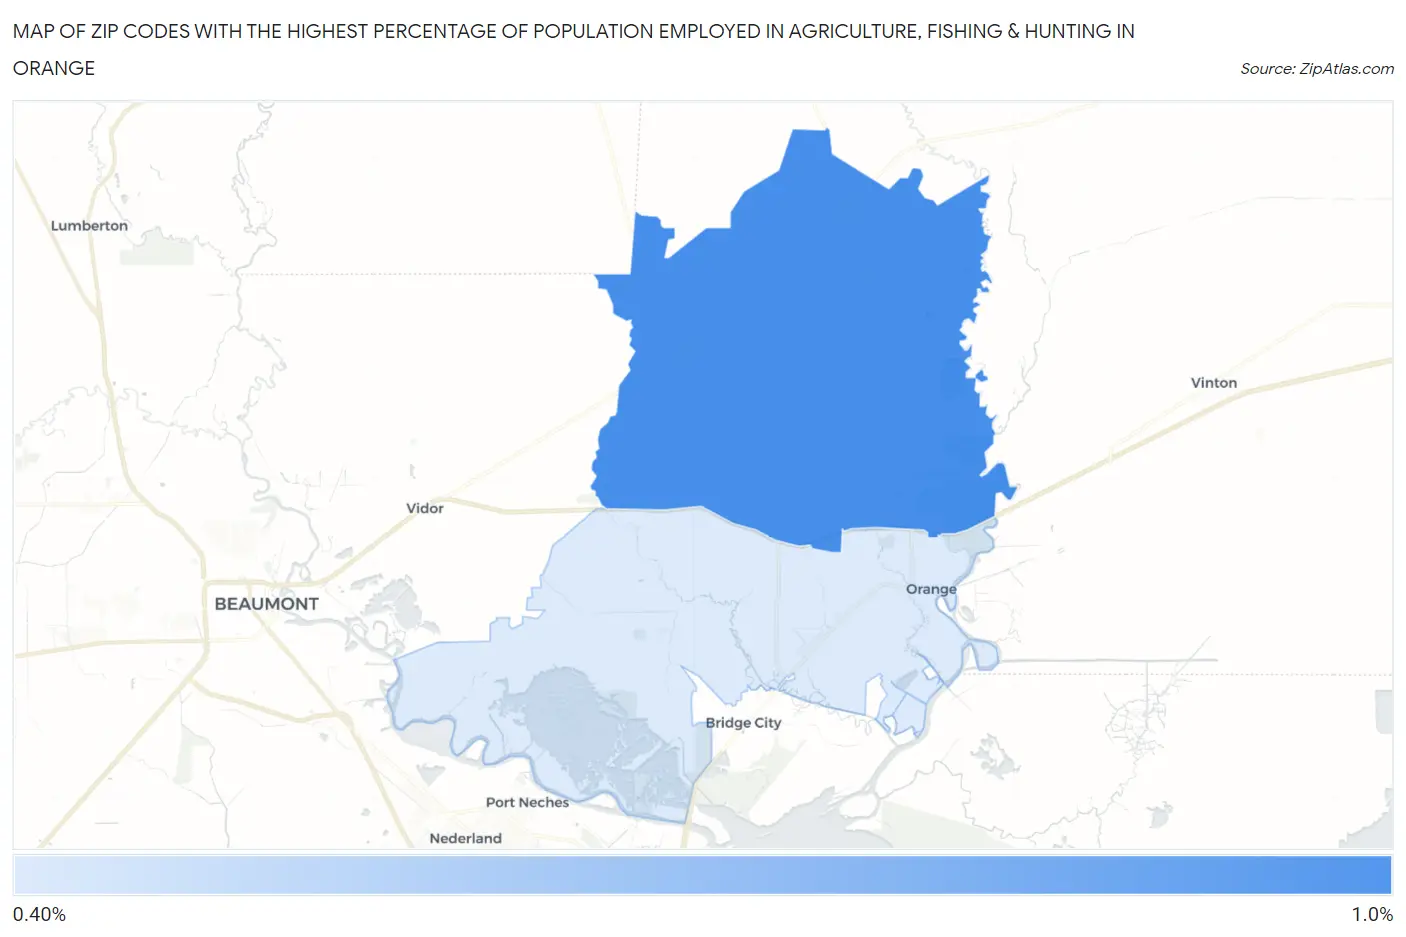
Map of Zip Codes with the Highest Percentage of Population Employed in Agriculture, Fishing & Hunting in Orange
0.0%
1.0%
Zip Codes with the Highest Percentage of Population Employed in Agriculture, Fishing & Hunting in Orange, TX
| Zip Code | % Employed | vs State | vs National | |
| 1. | 77632 | 0.92% | 0.75%(+0.172)#871 | 1.2%(-0.276)#16,590 |
| 2. | 77630 | 0.47% | 0.75%(-0.279)#1,055 | 1.2%(-0.727)#19,516 |
1
Common Questions
What are the Top Zip Codes with the Highest Percentage of Population Employed in Agriculture, Fishing & Hunting in Orange, TX?
Top Zip Codes with the Highest Percentage of Population Employed in Agriculture, Fishing & Hunting in Orange, TX are:
What zip code has the Highest Percentage of Population Employed in Agriculture, Fishing & Hunting in Orange, TX?
77632 has the Highest Percentage of Population Employed in Agriculture, Fishing & Hunting in Orange, TX with 0.92%.
What is the Percentage of Population Employed in Agriculture, Fishing & Hunting in Texas?
Percentage of Population Employed in Agriculture, Fishing & Hunting in Texas is 0.75%.
What is the Percentage of Population Employed in Agriculture, Fishing & Hunting in the United States?
Percentage of Population Employed in Agriculture, Fishing & Hunting in the United States is 1.2%.