Zip Codes with the Highest Percentage of Population Employed in Farming, Fishing & Forestry in Orange, TX
RELATED REPORTS & OPTIONS
Select to Compare
Select to Compare
Compare Zip Codes
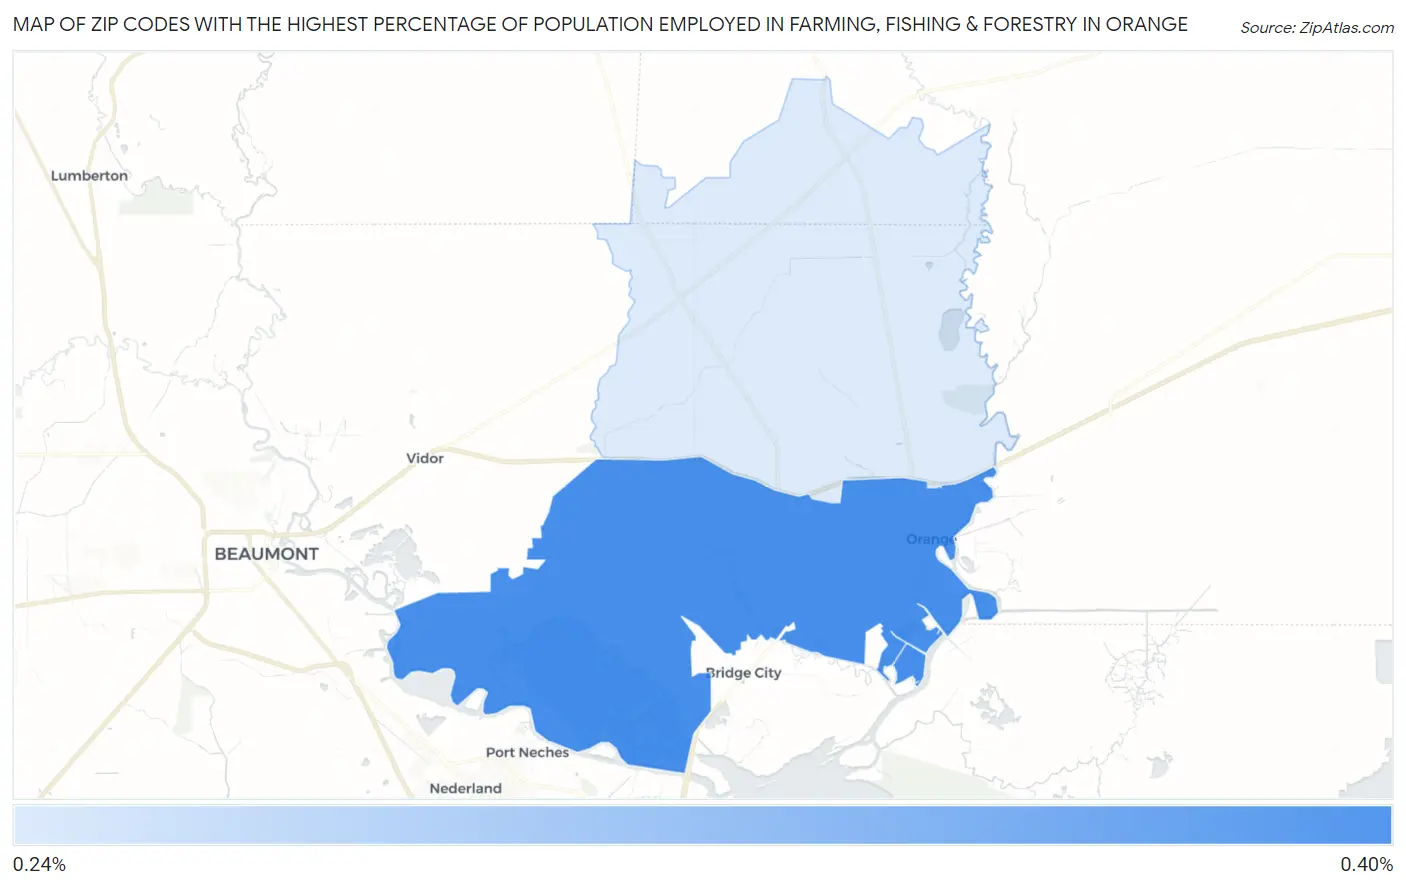
Map of Zip Codes with the Highest Percentage of Population Employed in Farming, Fishing & Forestry in Orange
0.0%
0.20%
Zip Codes with the Highest Percentage of Population Employed in Farming, Fishing & Forestry in Orange, TX
| Zip Code | % Employed | vs State | vs National | |
| 1. | 77630 | 0.20% | 0.37%(-0.177)#891 | 0.61%(-0.410)#16,193 |
1
Common Questions
What are the Top Zip Codes with the Highest Percentage of Population Employed in Farming, Fishing & Forestry in Orange, TX?
Top Zip Codes with the Highest Percentage of Population Employed in Farming, Fishing & Forestry in Orange, TX are:
What zip code has the Highest Percentage of Population Employed in Farming, Fishing & Forestry in Orange, TX?
77630 has the Highest Percentage of Population Employed in Farming, Fishing & Forestry in Orange, TX with 0.20%.
What is the Percentage of Population Employed in Farming, Fishing & Forestry in Texas?
Percentage of Population Employed in Farming, Fishing & Forestry in Texas is 0.37%.
What is the Percentage of Population Employed in Farming, Fishing & Forestry in the United States?
Percentage of Population Employed in Farming, Fishing & Forestry in the United States is 0.61%.