Zip Codes with the Highest Percentage of Hispanic or Latino Population in Odessa, TX
RELATED REPORTS & OPTIONS
Hispanic or Latino
Odessa
Compare Zip Codes
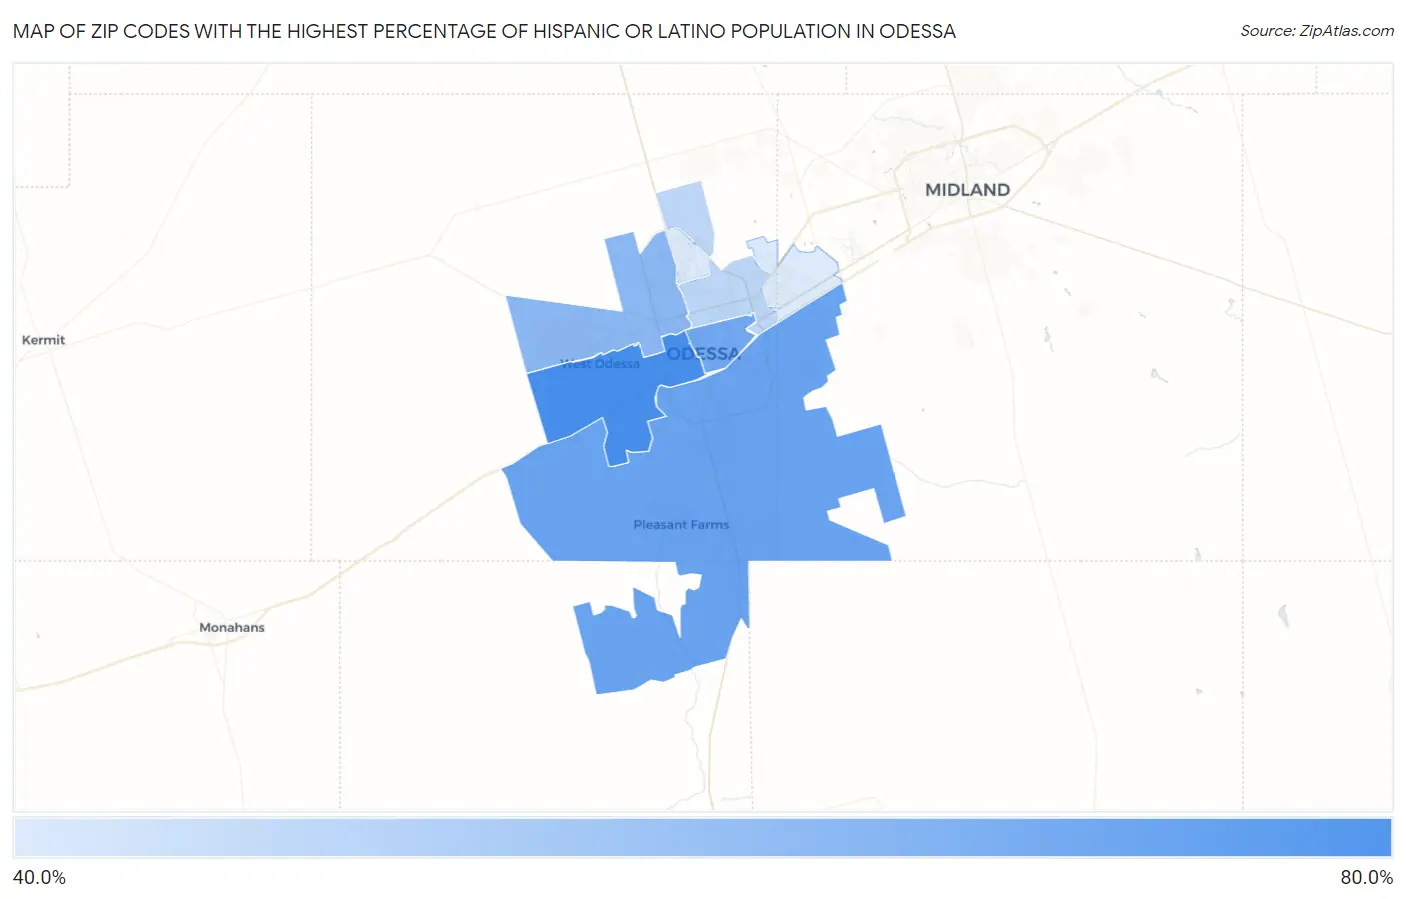
Map of Zip Codes with the Highest Percentage of Hispanic or Latino Population in Odessa
46.6%
77.1%
Zip Codes with the Highest Percentage of Hispanic or Latino Population in Odessa, TX
| Zip Code | Hispanic or Latino | vs State | vs National | |
| 1. | 79763 | 77.1% | 39.9%(+37.2)#197 | 18.7%(+58.4)#612 |
| 2. | 79766 | 70.2% | 39.9%(+30.3)#254 | 18.7%(+51.6)#790 |
| 3. | 79761 | 67.9% | 39.9%(+28.0)#273 | 18.7%(+49.2)#859 |
| 4. | 79764 | 62.7% | 39.9%(+22.8)#308 | 18.7%(+44.1)#1,008 |
| 5. | 79762 | 52.8% | 39.9%(+12.9)#418 | 18.7%(+34.1)#1,404 |
| 6. | 79765 | 46.6% | 39.9%(+6.68)#505 | 18.7%(+27.9)#1,733 |
1
Common Questions
What are the Top 5 Zip Codes with the Highest Percentage of Hispanic or Latino Population in Odessa, TX?
Top 5 Zip Codes with the Highest Percentage of Hispanic or Latino Population in Odessa, TX are:
What zip code has the Highest Percentage of Hispanic or Latino Population in Odessa, TX?
79763 has the Highest Percentage of Hispanic or Latino Population in Odessa, TX with 77.1%.
What is the Percentage of Hispanic or Latino Population in Odessa, TX?
Percentage of Hispanic or Latino Population in Odessa is 62.0%.
What is the Percentage of Hispanic or Latino Population in Texas?
Percentage of Hispanic or Latino Population in Texas is 39.9%.
What is the Percentage of Hispanic or Latino Population in the United States?
Percentage of Hispanic or Latino Population in the United States is 18.7%.