Zip Codes with the Highest Percentage of Population Employed in Agriculture, Fishing & Hunting in Magnolia, TX
RELATED REPORTS & OPTIONS
Agriculture, Fishing & Hunting
Magnolia
Compare Zip Codes
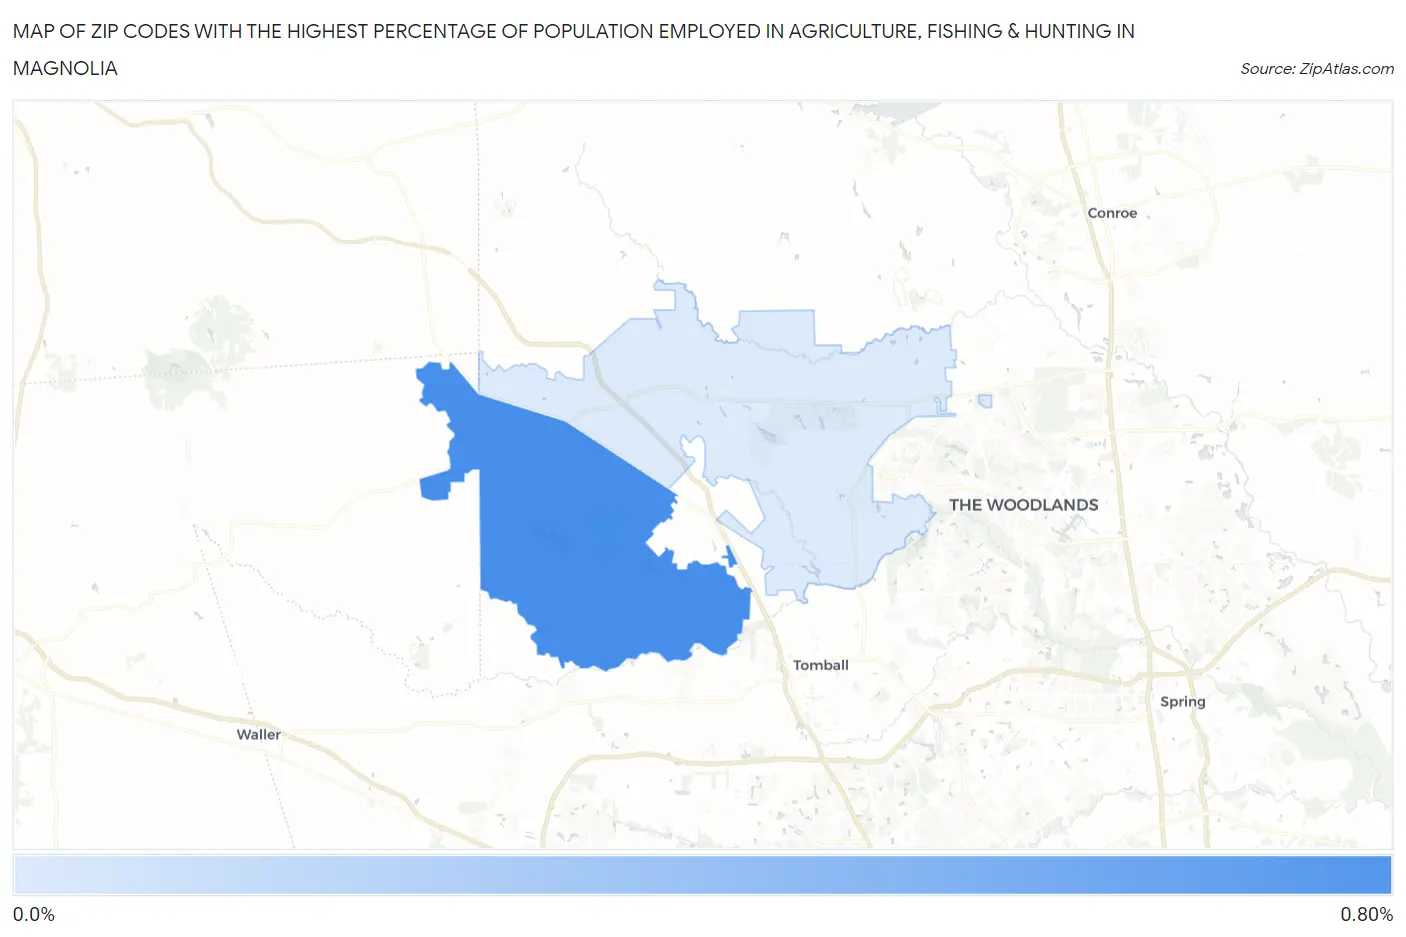
Map of Zip Codes with the Highest Percentage of Population Employed in Agriculture, Fishing & Hunting in Magnolia
0.0%
0.80%
Zip Codes with the Highest Percentage of Population Employed in Agriculture, Fishing & Hunting in Magnolia, TX
| Zip Code | % Employed | vs State | vs National | |
| 1. | 77355 | 0.67% | 0.75%(-0.079)#956 | 1.2%(-0.527)#18,011 |
| 2. | 77354 | 0.15% | 0.75%(-0.602)#1,301 | 1.2%(-1.05)#23,017 |
1
Common Questions
What are the Top Zip Codes with the Highest Percentage of Population Employed in Agriculture, Fishing & Hunting in Magnolia, TX?
Top Zip Codes with the Highest Percentage of Population Employed in Agriculture, Fishing & Hunting in Magnolia, TX are:
What zip code has the Highest Percentage of Population Employed in Agriculture, Fishing & Hunting in Magnolia, TX?
77355 has the Highest Percentage of Population Employed in Agriculture, Fishing & Hunting in Magnolia, TX with 0.67%.
What is the Percentage of Population Employed in Agriculture, Fishing & Hunting in Magnolia, TX?
Percentage of Population Employed in Agriculture, Fishing & Hunting in Magnolia is 0.64%.
What is the Percentage of Population Employed in Agriculture, Fishing & Hunting in Texas?
Percentage of Population Employed in Agriculture, Fishing & Hunting in Texas is 0.75%.
What is the Percentage of Population Employed in Agriculture, Fishing & Hunting in the United States?
Percentage of Population Employed in Agriculture, Fishing & Hunting in the United States is 1.2%.