Zip Codes with the Highest Percentage of Hispanic or Latino Population in Lubbock, TX

RELATED REPORTS & OPTIONS

Hispanic or Latino
Population
Families and Households
Female Fertility
Female Fertility (Unmarried)
Race (Community Size)
Race (Percentage)
Ancestry (Community Size)
AfricanAmericanApacheArabArgentineanArmenianAustrianBelgianBhutaneseBlackfeetBolivianBrazilianBritishBurmeseCajunCanadianCelticCentral AmericanCentral American IndianCherokeeCheyenneChickasawChileanChippewaChoctawColombianComancheCreekCubanCzechCzechoslovakianDanishDutchDutch West IndianEastern EuropeanEcuadorianEgyptianEnglishEthiopianEuropeanFijianFilipinoFinnishFrenchFrench CanadianGermanGhanaianGreekGuamanian / ChamorroGuatemalanHaitianHonduranHungarianIndian (Asian)IranianIrishIsraeliItalianJamaicanJapaneseJordanianKenyanKoreanLaotianLebaneseLithuanianMenomineeMexicanMexican American IndianNative HawaiianNavajoNicaraguanNigerianNorthern EuropeanNorwegianPakistaniPanamanianPennsylvania GermanPeruvianPolishPortuguesePotawatomiPuerto RicanRussianSalvadoranSamoanScandinavianScotch-IrishScottishSeminoleSierra LeoneanSlovakSloveneSomaliSouth AmericanSpaniardSpanishSpanish AmericanSri LankanSubsaharan AfricanSwedishSwissThaiTrinidadian and TobagonianTurkishUkrainianVenezuelanVietnameseWelshYaqui
Ancestry (Percentage)
AfricanAmericanApacheArabArgentineanArmenianAustrianBelgianBhutaneseBlackfeetBolivianBrazilianBritishBurmeseCajunCanadianCelticCentral AmericanCentral American IndianCherokeeCheyenneChickasawChileanChippewaChoctawColombianComancheCreekCubanCzechCzechoslovakianDanishDutchDutch West IndianEastern EuropeanEcuadorianEgyptianEnglishEthiopianEuropeanFijianFilipinoFinnishFrenchFrench CanadianGermanGhanaianGreekGuamanian / ChamorroGuatemalanHaitianHonduranHungarianIndian (Asian)IranianIrishIsraeliItalianJamaicanJapaneseJordanianKenyanKoreanLaotianLebaneseLithuanianMenomineeMexicanMexican American IndianNative HawaiianNavajoNicaraguanNigerianNorthern EuropeanNorwegianPakistaniPanamanianPennsylvania GermanPeruvianPolishPortuguesePotawatomiPuerto RicanRussianSalvadoranSamoanScandinavianScotch-IrishScottishSeminoleSierra LeoneanSlovakSloveneSomaliSouth AmericanSpaniardSpanishSpanish AmericanSri LankanSubsaharan AfricanSwedishSwissThaiTrinidadian and TobagonianTurkishUkrainianVenezuelanVietnameseWelshYaqui
Immigrant Origin (Total)
Immigrant Origin (Percentage)
Income
Income (Families)
Income (Households)
Poverty
Poverty (Families)
Unemployment
Employment Occupations
Employment Industries
Employer Class
Commute Time
Commute Means
School Enrollment
Education by Degree Field
Occupancy
Finances
Physical Characteristics
Lubbock
Compare Zip Codes
Comparison Subject

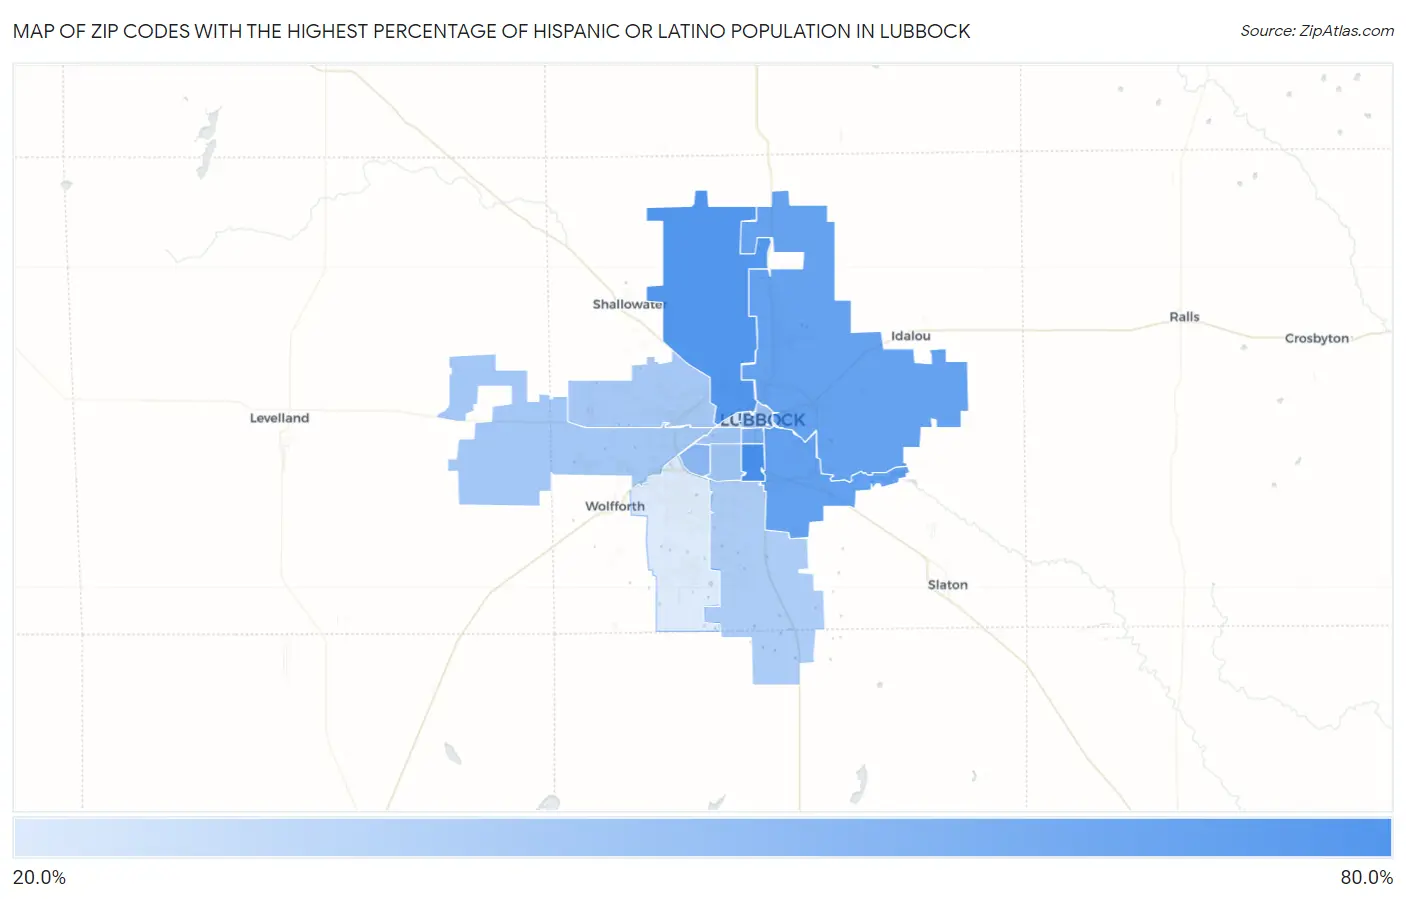
Map of Zip Codes with the Highest Percentage of Hispanic or Latino Population in Lubbock

0.0%
80.0%
Zip Codes with the Highest Percentage of Hispanic or Latino Population in Lubbock Map

Zip Codes with the Highest Percentage of Hispanic or Latino Population in Lubbock, TX

Zip Code Hispanic or Latino vs State vs National
1.7941262.4%39.9%(+22.5)#31218.7%(+43.7)#1,020
2.7941558.7%39.9%(+18.8)#34718.7%(+40.0)#1,162
3.7940453.6%39.9%(+13.7)#40418.7%(+34.9)#1,371
4.7940353.1%39.9%(+13.2)#40818.7%(+34.4)#1,387
5.7941147.0%39.9%(+7.07)#49618.7%(+28.3)#1,704
6.7941441.7%39.9%(+1.85)#58518.7%(+23.1)#2,052
7.7940137.0%39.9%(-2.84)#66718.7%(+18.4)#2,385
8.7941336.0%39.9%(-3.94)#68418.7%(+17.3)#2,475
9.7941035.4%39.9%(-4.46)#69918.7%(+16.8)#2,524
10.7940734.8%39.9%(-5.11)#71318.7%(+16.1)#2,580
11.7941634.5%39.9%(-5.42)#72118.7%(+15.8)#2,613
12.7942332.5%39.9%(-7.43)#76318.7%(+13.8)#2,830
13.7940622.2%39.9%(-17.7)#1,04118.7%(+3.58)#4,295
14.7942420.1%39.9%(-19.8)#1,13618.7%(+1.42)#4,794

Common Questions

What are the Top 10 Zip Codes with the Highest Percentage of Hispanic or Latino Population in Lubbock, TX?
Top 10 Zip Codes with the Highest Percentage of Hispanic or Latino Population in Lubbock, TX are:
#1
62.4%
#2
58.7%
#3
53.6%
#4
53.1%
#5
47.0%
#6
41.7%
#7
37.0%
#8
36.0%
#9
35.4%
#10
34.8%
What zip code has the Highest Percentage of Hispanic or Latino Population in Lubbock, TX?
79412 has the Highest Percentage of Hispanic or Latino Population in Lubbock, TX with 62.4%.
What is the Percentage of Hispanic or Latino Population in Lubbock, TX?
Percentage of Hispanic or Latino Population in Lubbock is 37.6%.
What is the Percentage of Hispanic or Latino Population in Texas?
Percentage of Hispanic or Latino Population in Texas is 39.9%.
What is the Percentage of Hispanic or Latino Population in the United States?
Percentage of Hispanic or Latino Population in the United States is 18.7%.