Zip Codes with the Highest Percentage of Population Employed in Arts, Entertainment & Recreation in Lewisville, TX

RELATED REPORTS & OPTIONS

Arts, Entertainment & Recreation
Population
Families and Households
Female Fertility
Female Fertility (Unmarried)
Race (Community Size)
Race (Percentage)
Ancestry (Community Size)
AfricanAlbanianAmericanApacheArabArgentineanArmenianAustralianAustrianBangladeshiBarbadianBelgianBhutaneseBrazilianBritishBurmeseCanadianCentral AmericanCherokeeChickasawChoctawColombianCreekCroatianCubanCzechCzechoslovakianDanishDominicanDutchDutch West IndianEastern EuropeanEcuadorianEgyptianEnglishEuropeanFilipinoFinnishFrenchFrench CanadianGermanGreekGuamanian / ChamorroGuatemalanHonduranHungarianIndian (Asian)IndonesianIranianIrishItalianJamaicanJapaneseJordanianKenyanKoreanLaotianLebaneseLithuanianMexicanMexican American IndianNative HawaiianNigerianNorthern EuropeanNorwegianPakistaniPanamanianPennsylvania GermanPeruvianPolishPortuguesePuerto RicanRomanianRussianSalvadoranSamoanScandinavianScotch-IrishScottishSlavicSlovakSouth AmericanSpaniardSpanishSri LankanSubsaharan AfricanSwedishSwissThaiUkrainianVenezuelanWelshWest IndianZimbabwean
Ancestry (Percentage)
AfricanAlbanianAmericanApacheArabArgentineanArmenianAustralianAustrianBangladeshiBarbadianBelgianBhutaneseBrazilianBritishBurmeseCanadianCentral AmericanCherokeeChickasawChoctawColombianCreekCroatianCubanCzechCzechoslovakianDanishDominicanDutchDutch West IndianEastern EuropeanEcuadorianEgyptianEnglishEuropeanFilipinoFinnishFrenchFrench CanadianGermanGreekGuamanian / ChamorroGuatemalanHonduranHungarianIndian (Asian)IndonesianIranianIrishItalianJamaicanJapaneseJordanianKenyanKoreanLaotianLebaneseLithuanianMexicanMexican American IndianNative HawaiianNigerianNorthern EuropeanNorwegianPakistaniPanamanianPennsylvania GermanPeruvianPolishPortuguesePuerto RicanRomanianRussianSalvadoranSamoanScandinavianScotch-IrishScottishSlavicSlovakSouth AmericanSpaniardSpanishSri LankanSubsaharan AfricanSwedishSwissThaiUkrainianVenezuelanWelshWest IndianZimbabwean
Immigrant Origin (Total)
Immigrant Origin (Percentage)
Income
Income (Families)
Income (Households)
Poverty
Poverty (Families)
Unemployment
Employment Occupations
Employment Industries
Employer Class
Commute Time
Commute Means
School Enrollment
Education by Degree Field
Occupancy
Finances
Physical Characteristics
Lewisville
Compare Zip Codes
Comparison Subject

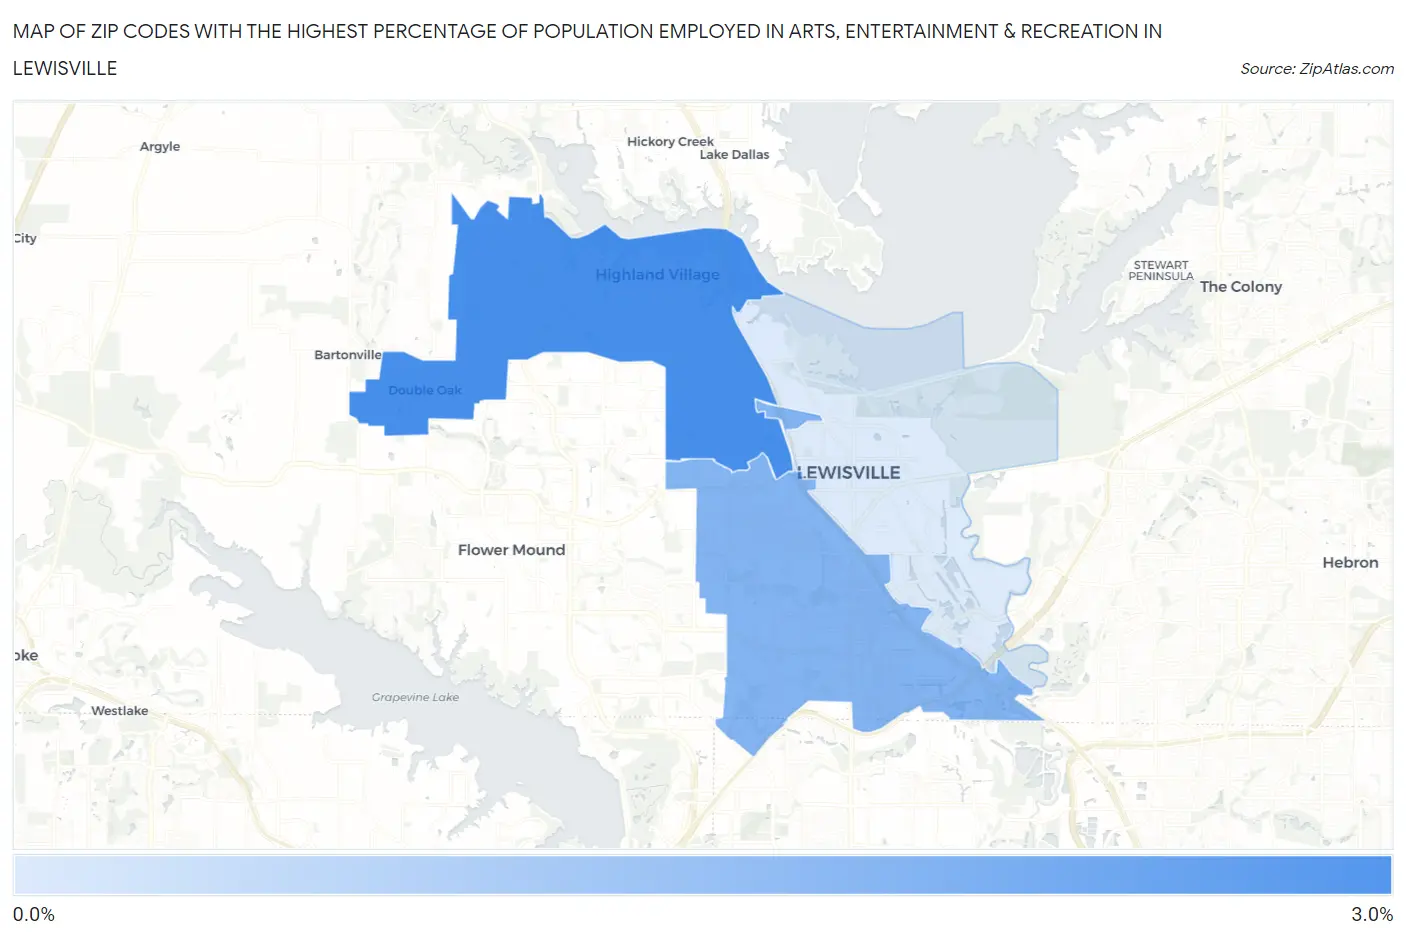
Map of Zip Codes with the Highest Percentage of Population Employed in Arts, Entertainment & Recreation in Lewisville

0.0%
3.0%
Zip Codes with the Highest Percentage of Population Employed in Arts, Entertainment & Recreation in Lewisville Map

Zip Codes with the Highest Percentage of Population Employed in Arts, Entertainment & Recreation in Lewisville, TX

Zip Code % Employed vs State vs National
1.750772.7%1.5%(+1.21)#1902.1%(+0.591)#6,473
2.750671.7%1.5%(+0.278)#4512.1%(-0.342)#11,434
3.750570.34%1.5%(-1.12)#1,1562.1%(-1.74)#21,501

Common Questions

What are the Top Zip Codes with the Highest Percentage of Population Employed in Arts, Entertainment & Recreation in Lewisville, TX?
Top Zip Codes with the Highest Percentage of Population Employed in Arts, Entertainment & Recreation in Lewisville, TX are:
#1
2.7%
#2
1.7%
#3
0.34%
What zip code has the Highest Percentage of Population Employed in Arts, Entertainment & Recreation in Lewisville, TX?
75077 has the Highest Percentage of Population Employed in Arts, Entertainment & Recreation in Lewisville, TX with 2.7%.
What is the Percentage of Population Employed in Arts, Entertainment & Recreation in Lewisville, TX?
Percentage of Population Employed in Arts, Entertainment & Recreation in Lewisville is 1.7%.
What is the Percentage of Population Employed in Arts, Entertainment & Recreation in Texas?
Percentage of Population Employed in Arts, Entertainment & Recreation in Texas is 1.5%.
What is the Percentage of Population Employed in Arts, Entertainment & Recreation in the United States?
Percentage of Population Employed in Arts, Entertainment & Recreation in the United States is 2.1%.