Zip Codes with the Highest Percentage of Owner-Occupied Units in Lancaster, TX
RELATED REPORTS & OPTIONS
Highest Owner-Occupied
Lancaster
Compare Zip Codes
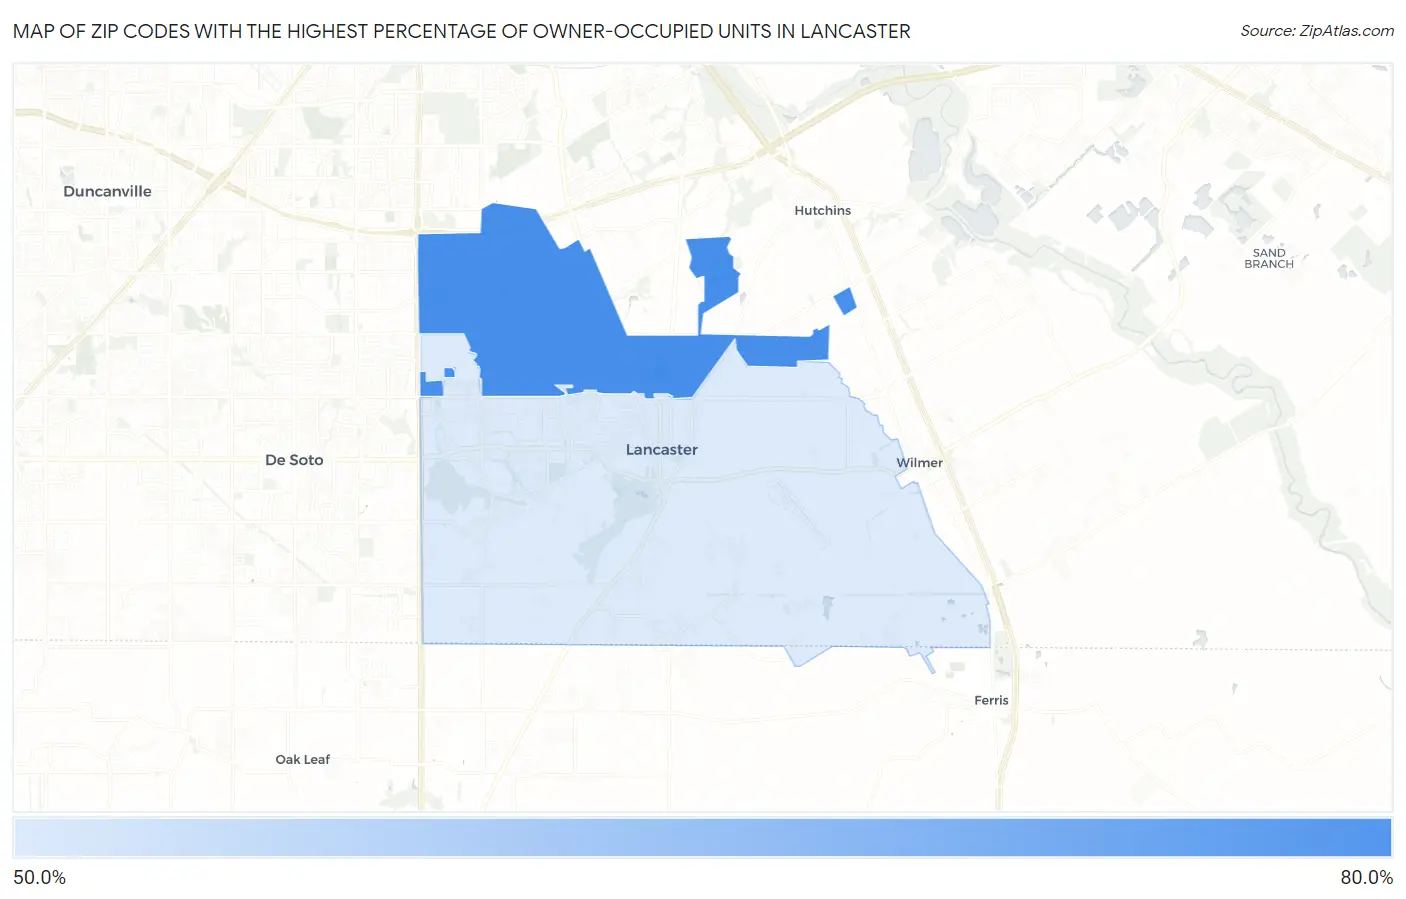
Map of Zip Codes with the Highest Percentage of Owner-Occupied Units in Lancaster
0.0%
80.0%
Zip Codes with the Highest Percentage of Owner-Occupied Units in Lancaster, TX
| Zip Code | % Owner-Occupied | vs State | vs National | |
| 1. | 75134 | 74.9% | 62.4%(+12.5)#930 | 64.8%(+10.1)#19,312 |
| 2. | 75146 | 58.5% | 62.4%(-3.92)#1,493 | 64.8%(-6.34)#27,866 |
1
Common Questions
What are the Top Zip Codes with the Highest Percentage of Owner-Occupied Units in Lancaster, TX?
Top Zip Codes with the Highest Percentage of Owner-Occupied Units in Lancaster, TX are:
What zip code has the Highest Percentage of Owner-Occupied Units in Lancaster, TX?
75134 has the Highest Percentage of Owner-Occupied Units in Lancaster, TX with 74.9%.
What is the Percentage of Owner-Occupied Units in Lancaster, TX?
Percentage of Owner-Occupied Units in Lancaster is 64.1%.
What is the Percentage of Owner-Occupied Units in Texas?
Percentage of Owner-Occupied Units in Texas is 62.4%.
What is the Percentage of Owner-Occupied Units in the United States?
Percentage of Owner-Occupied Units in the United States is 64.8%.