Zip Codes with the Highest Percentage of Population Employed in Farming, Fishing & Forestry in Killeen, TX

RELATED REPORTS & OPTIONS

Farming, Fishing & Forestry
Population
Families and Households
Female Fertility
Female Fertility (Unmarried)
Race (Community Size)
Race (Percentage)
Ancestry (Community Size)
AfricanAmericanApacheArabArgentineanArmenianAustrianBahamianBelizeanBhutaneseBlackfeetBrazilianBritishBritish West IndianBurmeseCajunCanadianCentral AmericanCentral American IndianCherokeeChoctawColombianComancheCreekCroatianCubanCzechCzechoslovakianDanishDominicanDutchEastern EuropeanEcuadorianEnglishEuropeanFinnishFrenchFrench CanadianGermanGhanaianGreekGuamanian / ChamorroGuatemalanHaitianHungarianIndian (Asian)IraqiIrishIroquoisIsraeliItalianJamaicanJapaneseKoreanLebaneseLithuanianMalaysianMexicanMexican American IndianNative HawaiianNavajoNicaraguanNigerianNorwegianPakistaniPanamanianPeruvianPolishPortuguesePuerto RicanRussianSalvadoranSamoanScandinavianScotch-IrishScottishSlovakSouth AmericanSpaniardSpanishSri LankanSubsaharan AfricanSwedishSwissThaiTrinidadian and TobagonianU.S. Virgin IslanderUkrainianWelshWest IndianYugoslavian
Ancestry (Percentage)
AfricanAmericanApacheArabArgentineanArmenianAustrianBahamianBelizeanBhutaneseBlackfeetBrazilianBritishBritish West IndianBurmeseCajunCanadianCentral AmericanCentral American IndianCherokeeChoctawColombianComancheCreekCroatianCubanCzechCzechoslovakianDanishDominicanDutchEastern EuropeanEcuadorianEnglishEuropeanFinnishFrenchFrench CanadianGermanGhanaianGreekGuamanian / ChamorroGuatemalanHaitianHungarianIndian (Asian)IraqiIrishIroquoisIsraeliItalianJamaicanJapaneseKoreanLebaneseLithuanianMalaysianMexicanMexican American IndianNative HawaiianNavajoNicaraguanNigerianNorwegianPakistaniPanamanianPeruvianPolishPortuguesePuerto RicanRussianSalvadoranSamoanScandinavianScotch-IrishScottishSlovakSouth AmericanSpaniardSpanishSri LankanSubsaharan AfricanSwedishSwissThaiTrinidadian and TobagonianU.S. Virgin IslanderUkrainianWelshWest IndianYugoslavian
Immigrant Origin (Total)
Immigrant Origin (Percentage)
Income
Income (Families)
Income (Households)
Poverty
Poverty (Families)
Unemployment
Employment Occupations
Employment Industries
Employer Class
Commute Time
Commute Means
School Enrollment
Education by Degree Field
Occupancy
Finances
Physical Characteristics
Killeen
Compare Zip Codes
Comparison Subject

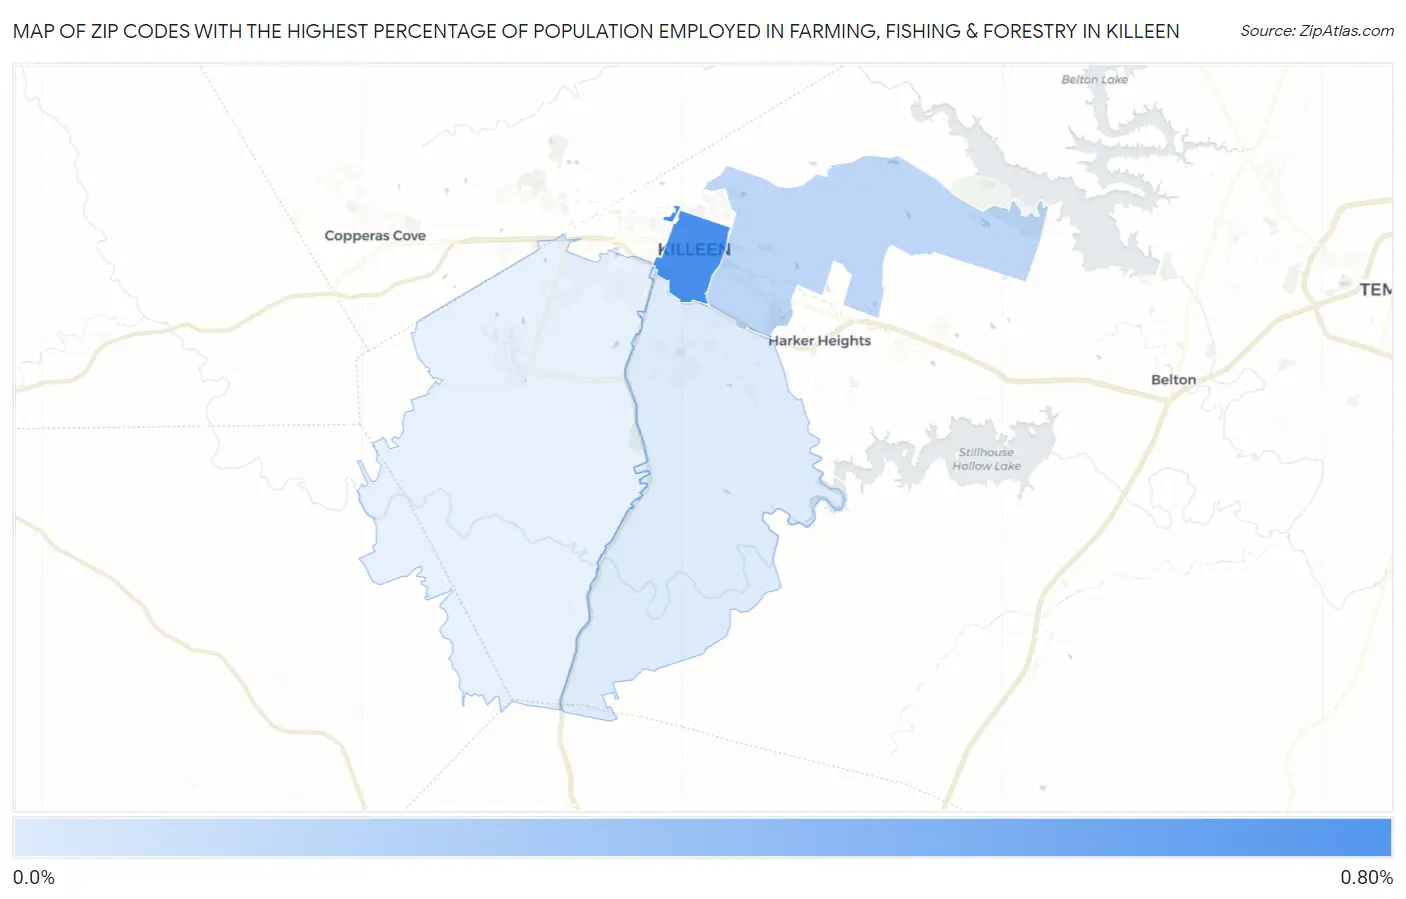
Map of Zip Codes with the Highest Percentage of Population Employed in Farming, Fishing & Forestry in Killeen

0.0%
0.80%
Zip Codes with the Highest Percentage of Population Employed in Farming, Fishing & Forestry in Killeen Map

Zip Codes with the Highest Percentage of Population Employed in Farming, Fishing & Forestry in Killeen, TX

Zip Code % Employed vs State vs National
1.765410.72%0.37%(+0.352)#5960.61%(+0.118)#11,239
2.765430.26%0.37%(-0.117)#8200.61%(-0.350)#15,340
3.765420.13%0.37%(-0.247)#9650.61%(-0.480)#17,343

Common Questions

What are the Top 3 Zip Codes with the Highest Percentage of Population Employed in Farming, Fishing & Forestry in Killeen, TX?
Top 3 Zip Codes with the Highest Percentage of Population Employed in Farming, Fishing & Forestry in Killeen, TX are:
#1
0.72%
#2
0.26%
#3
0.13%
What zip code has the Highest Percentage of Population Employed in Farming, Fishing & Forestry in Killeen, TX?
76541 has the Highest Percentage of Population Employed in Farming, Fishing & Forestry in Killeen, TX with 0.72%.
What is the Percentage of Population Employed in Farming, Fishing & Forestry in Killeen, TX?
Percentage of Population Employed in Farming, Fishing & Forestry in Killeen is 0.19%.
What is the Percentage of Population Employed in Farming, Fishing & Forestry in Texas?
Percentage of Population Employed in Farming, Fishing & Forestry in Texas is 0.37%.
What is the Percentage of Population Employed in Farming, Fishing & Forestry in the United States?
Percentage of Population Employed in Farming, Fishing & Forestry in the United States is 0.61%.