Zip Codes with the Highest Percentage of Population Employed in Arts, Entertainment & Recreation in Henderson, TX
RELATED REPORTS & OPTIONS
Select to Compare
Select to Compare
Compare Zip Codes
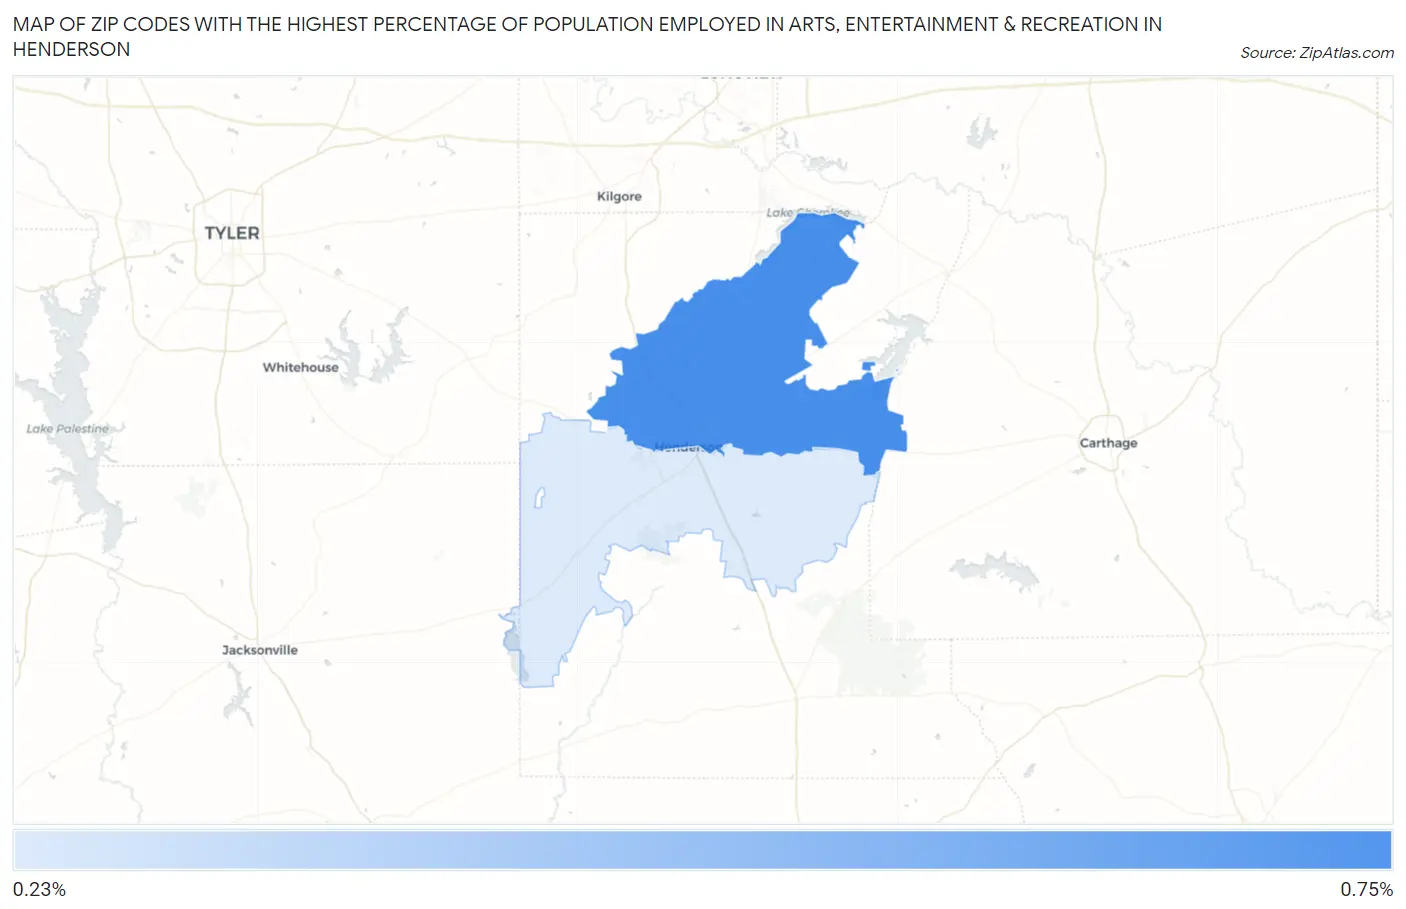
Map of Zip Codes with the Highest Percentage of Population Employed in Arts, Entertainment & Recreation in Henderson
0.0%
0.50%
Zip Codes with the Highest Percentage of Population Employed in Arts, Entertainment & Recreation in Henderson, TX
| Zip Code | % Employed | vs State | vs National | |
| 1. | 75652 | 0.40% | 1.5%(-1.06)#1,123 | 2.1%(-1.68)#21,100 |
1
Common Questions
What are the Top Zip Codes with the Highest Percentage of Population Employed in Arts, Entertainment & Recreation in Henderson, TX?
Top Zip Codes with the Highest Percentage of Population Employed in Arts, Entertainment & Recreation in Henderson, TX are:
What zip code has the Highest Percentage of Population Employed in Arts, Entertainment & Recreation in Henderson, TX?
75652 has the Highest Percentage of Population Employed in Arts, Entertainment & Recreation in Henderson, TX with 0.40%.
What is the Percentage of Population Employed in Arts, Entertainment & Recreation in Texas?
Percentage of Population Employed in Arts, Entertainment & Recreation in Texas is 1.5%.
What is the Percentage of Population Employed in Arts, Entertainment & Recreation in the United States?
Percentage of Population Employed in Arts, Entertainment & Recreation in the United States is 2.1%.