Zip Codes with the Highest Percentage of Population Employed in Arts, Entertainment & Recreation in Harlingen, TX
RELATED REPORTS & OPTIONS
Arts, Entertainment & Recreation
Harlingen
Compare Zip Codes
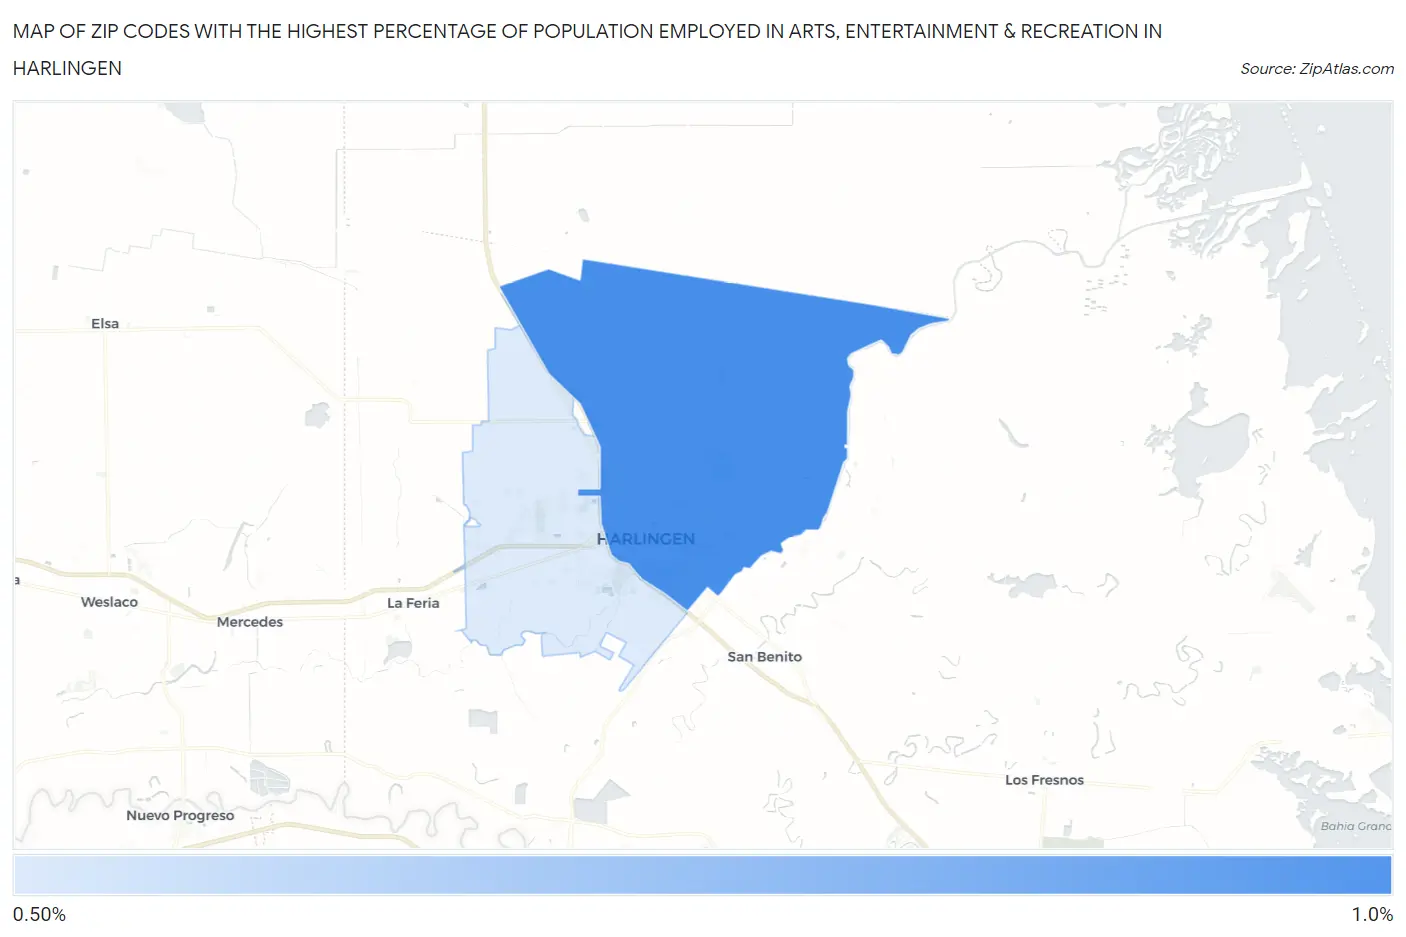
Map of Zip Codes with the Highest Percentage of Population Employed in Arts, Entertainment & Recreation in Harlingen
0.0%
1.0%
Zip Codes with the Highest Percentage of Population Employed in Arts, Entertainment & Recreation in Harlingen, TX
| Zip Code | % Employed | vs State | vs National | |
| 1. | 78550 | 0.89% | 1.5%(-0.570)#876 | 2.1%(-1.19)#17,740 |
| 2. | 78552 | 0.58% | 1.5%(-0.882)#1,036 | 2.1%(-1.50)#19,960 |
1
Common Questions
What are the Top Zip Codes with the Highest Percentage of Population Employed in Arts, Entertainment & Recreation in Harlingen, TX?
Top Zip Codes with the Highest Percentage of Population Employed in Arts, Entertainment & Recreation in Harlingen, TX are:
What zip code has the Highest Percentage of Population Employed in Arts, Entertainment & Recreation in Harlingen, TX?
78550 has the Highest Percentage of Population Employed in Arts, Entertainment & Recreation in Harlingen, TX with 0.89%.
What is the Percentage of Population Employed in Arts, Entertainment & Recreation in Harlingen, TX?
Percentage of Population Employed in Arts, Entertainment & Recreation in Harlingen is 0.69%.
What is the Percentage of Population Employed in Arts, Entertainment & Recreation in Texas?
Percentage of Population Employed in Arts, Entertainment & Recreation in Texas is 1.5%.
What is the Percentage of Population Employed in Arts, Entertainment & Recreation in the United States?
Percentage of Population Employed in Arts, Entertainment & Recreation in the United States is 2.1%.