Zip Codes with the Highest Percentage of Population Walking to Work in Greenville, TX
RELATED REPORTS & OPTIONS
Walk to Work
Greenville
Compare Zip Codes
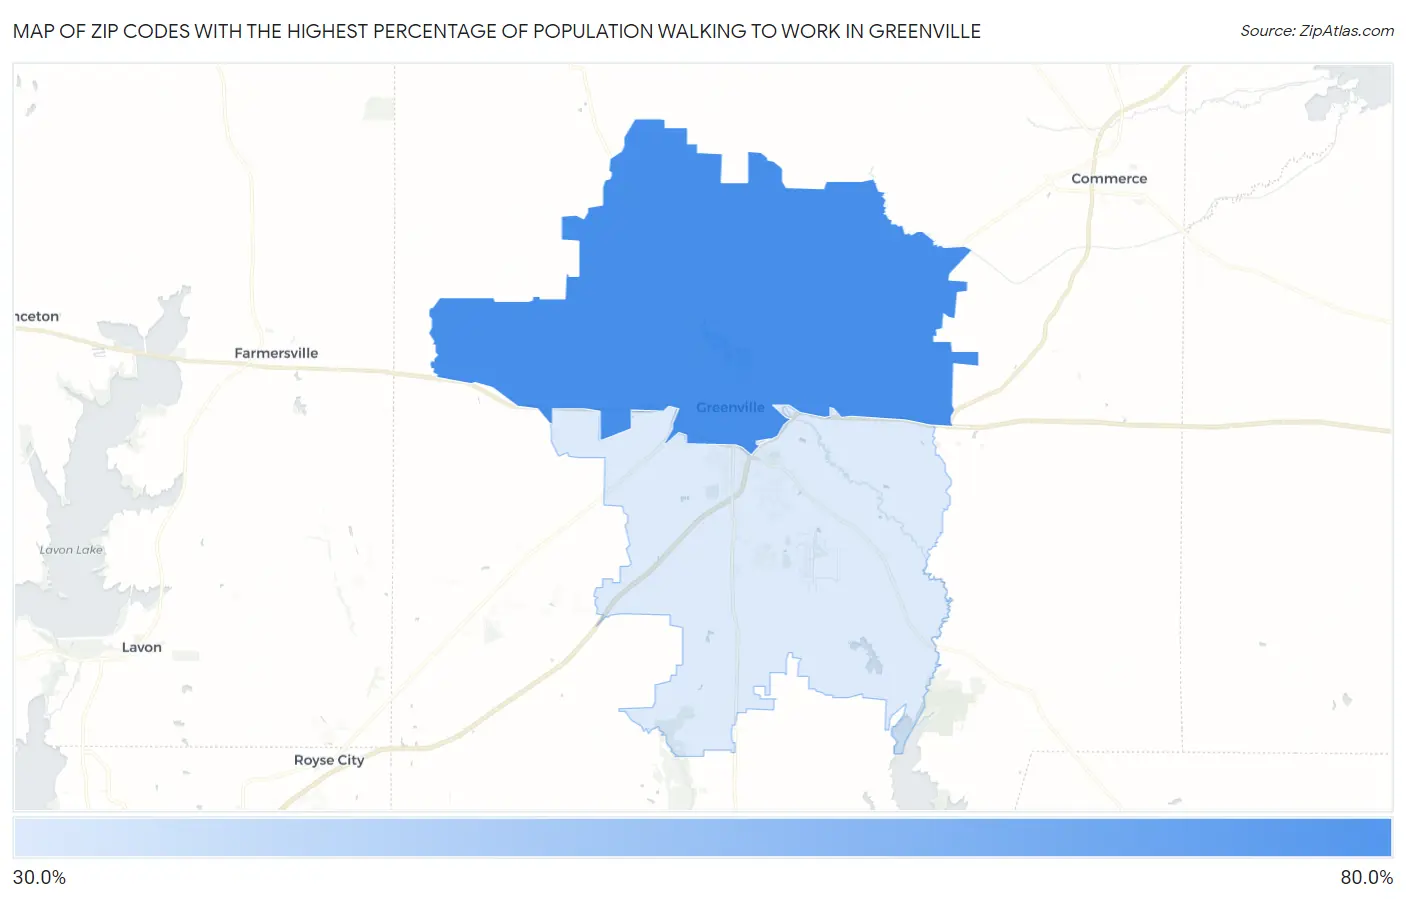
Map of Zip Codes with the Highest Percentage of Population Walking to Work in Greenville
0.0%
80.0%
Zip Codes with the Highest Percentage of Population Walking to Work in Greenville, TX
| Zip Code | % Walk to Work | vs State | vs National | |
| 1. | 75401 | 65.2% | 32.0%(+33.2)#24 | 33.4%(+31.8)#536 |
| 2. | 75402 | 38.3% | 32.0%(+6.30)#479 | 33.4%(+4.90)#9,121 |
1
Common Questions
What are the Top Zip Codes with the Highest Percentage of Population Walking to Work in Greenville, TX?
Top Zip Codes with the Highest Percentage of Population Walking to Work in Greenville, TX are:
What zip code has the Highest Percentage of Population Walking to Work in Greenville, TX?
75401 has the Highest Percentage of Population Walking to Work in Greenville, TX with 65.2%.
What is the Percentage of Population Walking to Work in Greenville, TX?
Percentage of Population Walking to Work in Greenville is 65.0%.
What is the Percentage of Population Walking to Work in Texas?
Percentage of Population Walking to Work in Texas is 32.0%.
What is the Percentage of Population Walking to Work in the United States?
Percentage of Population Walking to Work in the United States is 33.4%.