Zip Codes with the Highest Percentage of Self-Employed / Incorporated in Fort Worth, TX

RELATED REPORTS & OPTIONS

Self-Employed / Incorporated
Population
Families and Households
Female Fertility
Female Fertility (Unmarried)
Race (Community Size)
Race (Percentage)
Ancestry (Community Size)
AfghanAfricanAlbanianAlsatianAmericanApacheArabArgentineanArmenianAustralianAustrianBahamianBangladeshiBarbadianBasqueBelgianBhutaneseBlackfeetBolivianBrazilianBritishBritish West IndianBulgarianBurmeseCajunCambodianCanadianCelticCentral AmericanCentral American IndianCherokeeCheyenneChickasawChileanChippewaChoctawColombianComancheCosta RicanCreekCroatianCrowCubanCzechCzechoslovakianDanishDelawareDominicanDutchDutch West IndianEastern EuropeanEcuadorianEgyptianEnglishEstonianEthiopianEuropeanFilipinoFinnishFrenchFrench American IndianFrench CanadianGermanGerman RussianGhanaianGreekGuamanian / ChamorroGuatemalanGuyaneseHaitianHonduranHopiHungarianIcelanderIndian (Asian)IndonesianInupiatIranianIraqiIrishIroquoisIsraeliItalianJamaicanJapaneseJordanianKenyanKiowaKoreanLaotianLatvianLebaneseLiberianLithuanianLuxembourgerMalaysianMalteseMexicanMexican American IndianMongolianMoroccanNative HawaiianNavajoNicaraguanNigerianNorthern EuropeanNorwegianOsageOttawaPakistaniPalestinianPanamanianPennsylvania GermanPeruvianPolishPortuguesePotawatomiPuebloPuerto RicanRomanianRussianSalvadoranSamoanScandinavianScotch-IrishScottishSerbianSiouxSlavicSlovakSloveneSomaliSouth AfricanSouth AmericanSouth American IndianSpaniardSpanishSpanish AmericanSpanish American IndianSri LankanSubsaharan AfricanSudaneseSwedishSwissSyrianThaiTonganTrinidadian and TobagonianTurkishUgandanUkrainianVenezuelanVietnameseWelshWest IndianYaquiYugoslavianZimbabwean
Ancestry (Percentage)
AfghanAfricanAlbanianAlsatianAmericanApacheArabArgentineanArmenianAustralianAustrianBahamianBangladeshiBarbadianBasqueBelgianBhutaneseBlackfeetBolivianBrazilianBritishBritish West IndianBulgarianBurmeseCajunCambodianCanadianCelticCentral AmericanCentral American IndianCherokeeCheyenneChickasawChileanChippewaChoctawColombianComancheCosta RicanCreekCroatianCrowCubanCzechCzechoslovakianDanishDelawareDominicanDutchDutch West IndianEastern EuropeanEcuadorianEgyptianEnglishEstonianEthiopianEuropeanFilipinoFinnishFrenchFrench American IndianFrench CanadianGermanGerman RussianGhanaianGreekGuamanian / ChamorroGuatemalanGuyaneseHaitianHonduranHopiHungarianIcelanderIndian (Asian)IndonesianInupiatIranianIraqiIrishIroquoisIsraeliItalianJamaicanJapaneseJordanianKenyanKiowaKoreanLaotianLatvianLebaneseLiberianLithuanianLuxembourgerMalaysianMalteseMexicanMexican American IndianMongolianMoroccanNative HawaiianNavajoNicaraguanNigerianNorthern EuropeanNorwegianOsageOttawaPakistaniPalestinianPanamanianPennsylvania GermanPeruvianPolishPortuguesePotawatomiPuebloPuerto RicanRomanianRussianSalvadoranSamoanScandinavianScotch-IrishScottishSerbianSiouxSlavicSlovakSloveneSomaliSouth AfricanSouth AmericanSouth American IndianSpaniardSpanishSpanish AmericanSpanish American IndianSri LankanSubsaharan AfricanSudaneseSwedishSwissSyrianThaiTonganTrinidadian and TobagonianTurkishUgandanUkrainianVenezuelanVietnameseWelshWest IndianYaquiYugoslavianZimbabwean
Immigrant Origin (Total)
AfghanistanAfricaAlbaniaArgentinaAsiaAustraliaBahamasBangladeshBarbadosBelarusBelizeBoliviaBosnia and HerzegovinaBrazilBulgariaBurma / MyanmarCambodiaCameroonCanadaCaribbeanCentral AmericaChileChinaColombiaCongoCosta RicaCroatiaCubaCzechoslovakiaDominican RepublicEastern AfricaEastern AsiaEastern EuropeEcuadorEgyptEl SalvadorEnglandEritreaEthiopiaEuropeFranceGermanyGhanaGreeceGuatemalaHaitiHondurasHong KongHungaryIndiaIndonesiaIranIraqIrelandIsraelItalyJamaicaJapanJordanKenyaKoreaLaosLatin AmericaLebanonLiberiaMalaysiaMexicoMicronesiaMiddle AfricaMoroccoNepalNetherlandsNicaraguaNigeriaNorthern AfricaNorthern EuropeOceaniaPakistanPanamaPeruPhilippinesPolandPortugalRomaniaRussiaScotlandSenegalSerbiaSomaliaSouth AfricaSouth AmericaSouth Central AsiaSouth Eastern AsiaSouthern EuropeSpainSri LankaSudanSwedenSwitzerlandSyriaTaiwanThailandTrinidad and TobagoTurkeyUgandaUkraineVenezuelaVietnamWestern AfricaWestern AsiaWestern EuropeZaireZimbabwe
Immigrant Origin (Percentage)
AfghanistanAfricaAlbaniaArgentinaAsiaAustraliaBahamasBangladeshBarbadosBelarusBelizeBoliviaBosnia and HerzegovinaBrazilBulgariaBurma / MyanmarCambodiaCameroonCanadaCaribbeanCentral AmericaChileChinaColombiaCongoCosta RicaCroatiaCubaCzechoslovakiaDominican RepublicEastern AfricaEastern AsiaEastern EuropeEcuadorEgyptEl SalvadorEnglandEritreaEthiopiaEuropeFranceGermanyGhanaGreeceGuatemalaHaitiHondurasHong KongHungaryIndiaIndonesiaIranIraqIrelandIsraelItalyJamaicaJapanJordanKenyaKoreaLaosLatin AmericaLebanonLiberiaMalaysiaMexicoMicronesiaMiddle AfricaMoroccoNepalNetherlandsNicaraguaNigeriaNorthern AfricaNorthern EuropeOceaniaPakistanPanamaPeruPhilippinesPolandPortugalRomaniaRussiaScotlandSenegalSerbiaSomaliaSouth AfricaSouth AmericaSouth Central AsiaSouth Eastern AsiaSouthern EuropeSpainSri LankaSudanSwedenSwitzerlandSyriaTaiwanThailandTrinidad and TobagoTurkeyUgandaUkraineVenezuelaVietnamWestern AfricaWestern AsiaWestern EuropeZaireZimbabwe
Income
Income (Families)
Income (Households)
Poverty
Poverty (Families)
Unemployment
Employment Occupations
Employment Industries
Employer Class
Commute Time
Commute Means
School Enrollment
Education by Degree Field
Occupancy
Finances
Physical Characteristics
Fort Worth
Compare Zip Codes
Comparison Subject

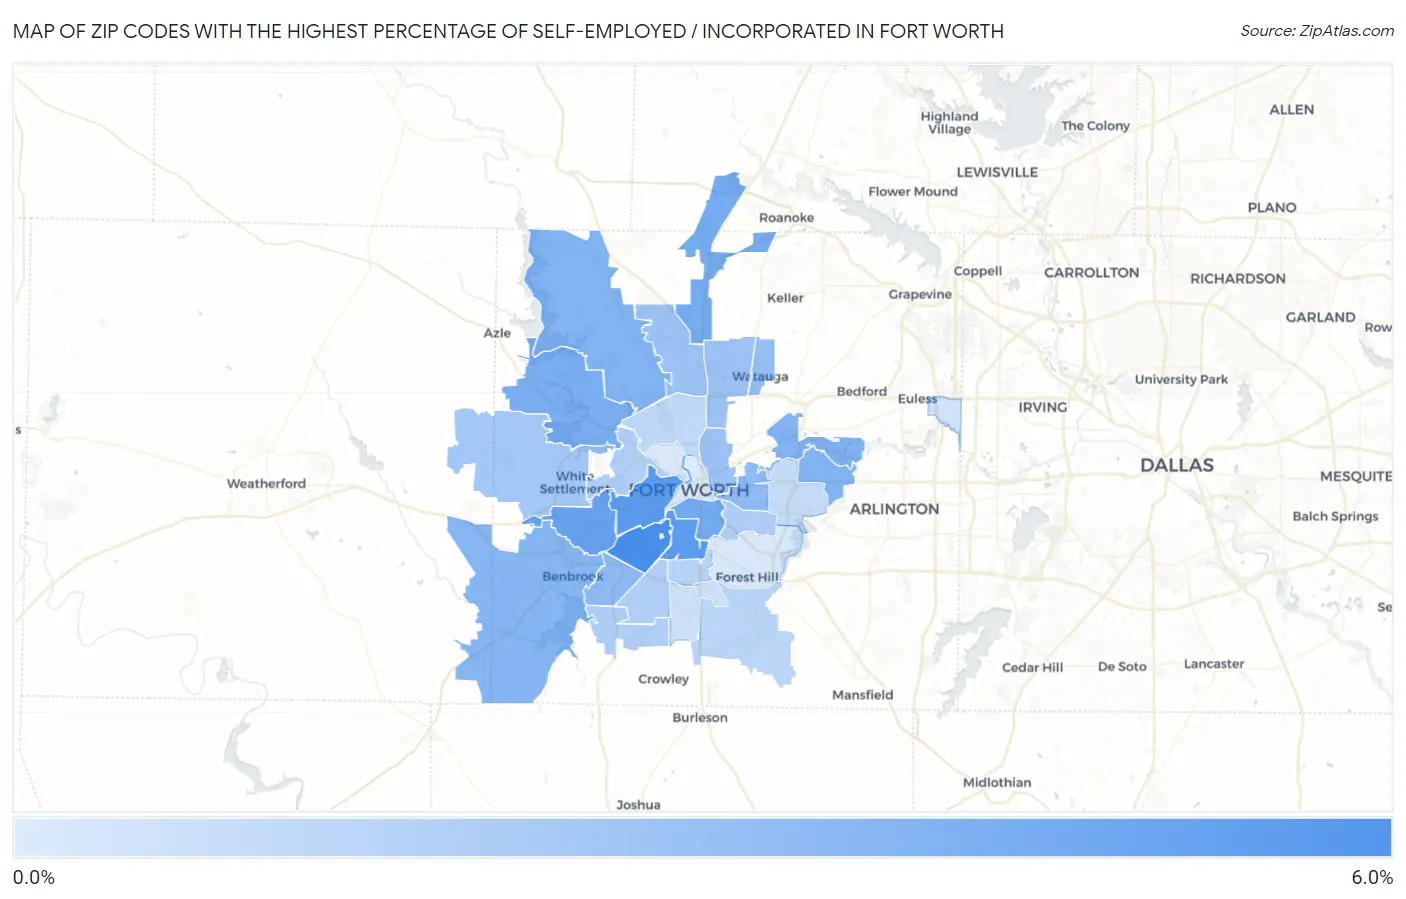
Map of Zip Codes with the Highest Percentage of Self-Employed / Incorporated in Fort Worth

0.0%
6.0%
Zip Codes with the Highest Percentage of Self-Employed / Incorporated in Fort Worth Map

Zip Codes with the Highest Percentage of Self-Employed / Incorporated in Fort Worth, TX

Zip Code % Self-Employed / Incorporated vs State vs National
1.761095.8%3.4%(+2.48)#2633.8%(+2.03)#6,632
2.761105.1%3.4%(+1.76)#3483.8%(+1.31)#8,272
3.761075.1%3.4%(+1.69)#3533.8%(+1.24)#8,435
4.761164.7%3.4%(+1.28)#4183.8%(+0.836)#9,606
5.761044.2%3.4%(+0.847)#5083.8%(+0.398)#11,128
6.761774.1%3.4%(+0.711)#5273.8%(+0.262)#11,601
7.761353.9%3.4%(+0.523)#5713.8%(+0.074)#12,383
8.761793.7%3.4%(+0.285)#6323.8%(-0.164)#13,378
9.761183.6%3.4%(+0.277)#6353.8%(-0.172)#13,410
10.761203.5%3.4%(+0.177)#6513.8%(-0.272)#13,831
11.761263.5%3.4%(+0.141)#6623.8%(-0.308)#13,980
12.761033.1%3.4%(-0.268)#7893.8%(-0.717)#15,887
13.761323.1%3.4%(-0.271)#7903.8%(-0.720)#15,902
14.761483.0%3.4%(-0.409)#8343.8%(-0.858)#16,602
15.761312.7%3.4%(-0.675)#9233.8%(-1.12)#17,923
16.761112.7%3.4%(-0.691)#9333.8%(-1.14)#18,015
17.761372.7%3.4%(-0.698)#9353.8%(-1.15)#18,051
18.761082.4%3.4%(-0.986)#1,0253.8%(-1.43)#19,472
19.761052.0%3.4%(-1.41)#1,1563.8%(-1.86)#21,565
20.761231.9%3.4%(-1.45)#1,1693.8%(-1.90)#21,734
21.761331.9%3.4%(-1.52)#1,1873.8%(-1.97)#22,046
22.761141.8%3.4%(-1.54)#1,1933.8%(-1.98)#22,140
23.761151.6%3.4%(-1.81)#1,2873.8%(-2.26)#23,278
24.761401.5%3.4%(-1.86)#1,3073.8%(-2.31)#23,459
25.761061.3%3.4%(-2.04)#1,3553.8%(-2.49)#24,134
26.761121.1%3.4%(-2.24)#1,4073.8%(-2.69)#24,892
27.761340.77%3.4%(-2.60)#1,4793.8%(-3.05)#25,885
28.761550.68%3.4%(-2.69)#1,4933.8%(-3.14)#26,109
29.761190.32%3.4%(-3.05)#1,5423.8%(-3.49)#26,764
30.761640.30%3.4%(-3.06)#1,5463.8%(-3.51)#26,788
31.761020.25%3.4%(-3.12)#1,5483.8%(-3.57)#26,846

Common Questions

What are the Top 10 Zip Codes with the Highest Percentage of Self-Employed / Incorporated in Fort Worth, TX?
Top 10 Zip Codes with the Highest Percentage of Self-Employed / Incorporated in Fort Worth, TX are:
#1
5.8%
#2
5.1%
#3
5.1%
#4
4.7%
#5
4.2%
#6
4.1%
#7
3.9%
#8
3.7%
#9
3.6%
#10
3.5%
What zip code has the Highest Percentage of Self-Employed / Incorporated in Fort Worth, TX?
76109 has the Highest Percentage of Self-Employed / Incorporated in Fort Worth, TX with 5.8%.
What is the Percentage of Self-Employed / Incorporated in Fort Worth, TX?
Percentage of Self-Employed / Incorporated in Fort Worth is 2.6%.
What is the Percentage of Self-Employed / Incorporated in Texas?
Percentage of Self-Employed / Incorporated in Texas is 3.4%.
What is the Percentage of Self-Employed / Incorporated in the United States?
Percentage of Self-Employed / Incorporated in the United States is 3.8%.