Zip Codes with the Highest Percentage of Population Employed in Transportation & Warehousing in Duncanville, TX
RELATED REPORTS & OPTIONS
Transportation & Warehousing
Duncanville
Compare Zip Codes
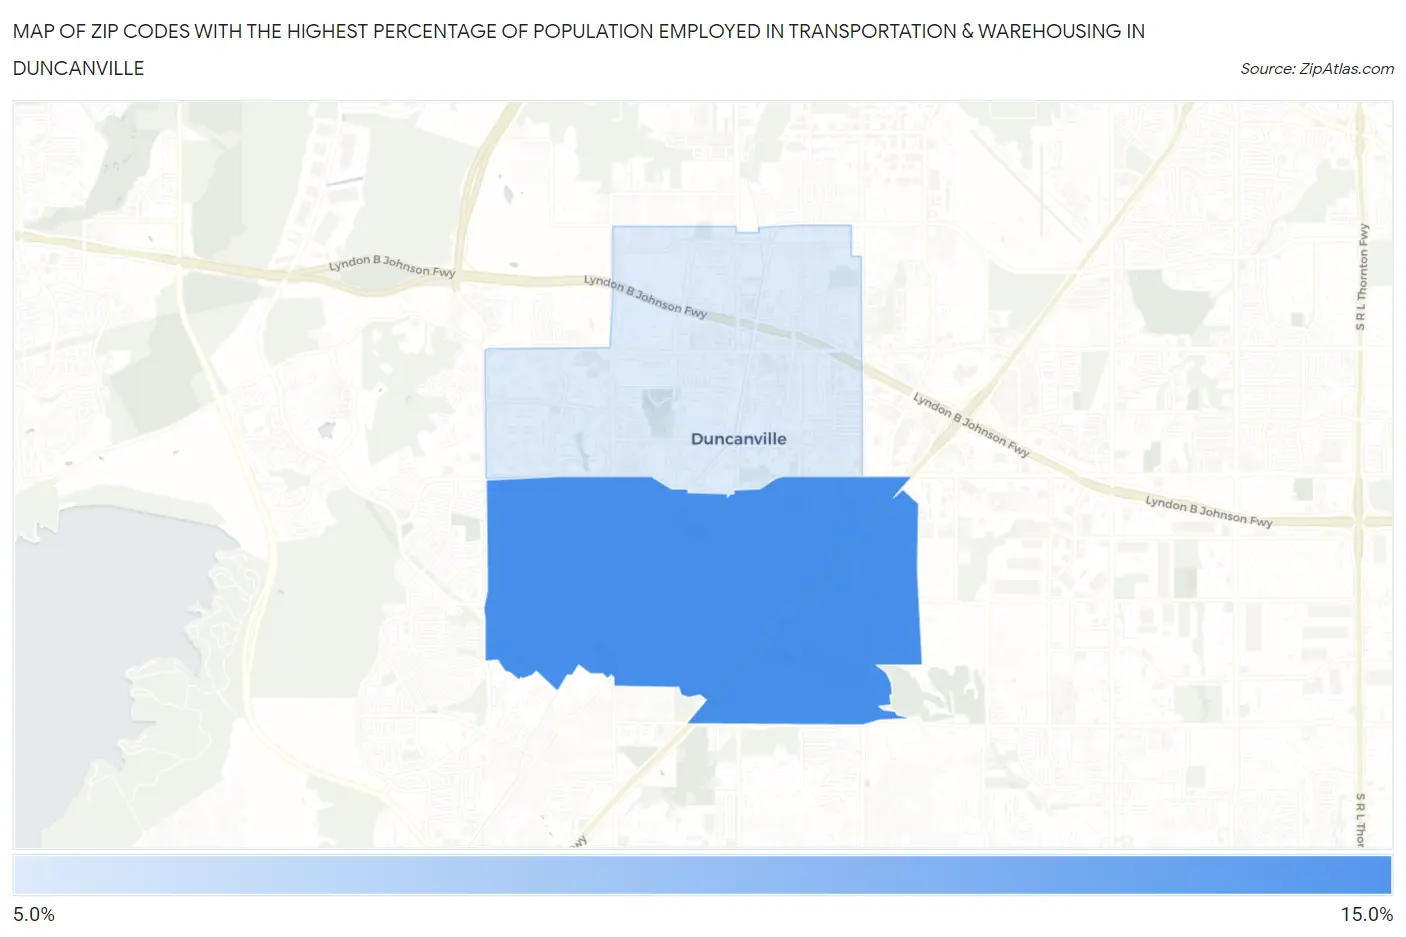
Map of Zip Codes with the Highest Percentage of Population Employed in Transportation & Warehousing in Duncanville
0.0%
15.0%
Zip Codes with the Highest Percentage of Population Employed in Transportation & Warehousing in Duncanville, TX
| Zip Code | % Employed | vs State | vs National | |
| 1. | 75137 | 10.8% | 5.5%(+5.28)#168 | 4.9%(+5.83)#2,439 |
| 2. | 75116 | 9.0% | 5.5%(+3.49)#268 | 4.9%(+4.04)#3,716 |
1
Common Questions
What are the Top Zip Codes with the Highest Percentage of Population Employed in Transportation & Warehousing in Duncanville, TX?
Top Zip Codes with the Highest Percentage of Population Employed in Transportation & Warehousing in Duncanville, TX are:
What zip code has the Highest Percentage of Population Employed in Transportation & Warehousing in Duncanville, TX?
75137 has the Highest Percentage of Population Employed in Transportation & Warehousing in Duncanville, TX with 10.8%.
What is the Percentage of Population Employed in Transportation & Warehousing in Duncanville, TX?
Percentage of Population Employed in Transportation & Warehousing in Duncanville is 9.9%.
What is the Percentage of Population Employed in Transportation & Warehousing in Texas?
Percentage of Population Employed in Transportation & Warehousing in Texas is 5.5%.
What is the Percentage of Population Employed in Transportation & Warehousing in the United States?
Percentage of Population Employed in Transportation & Warehousing in the United States is 4.9%.