Zip Codes with the Highest Percentage of Population Employed in Professional & Scientific Services in Duncanville, TX
RELATED REPORTS & OPTIONS
Professional & Scientific Services
Duncanville
Compare Zip Codes
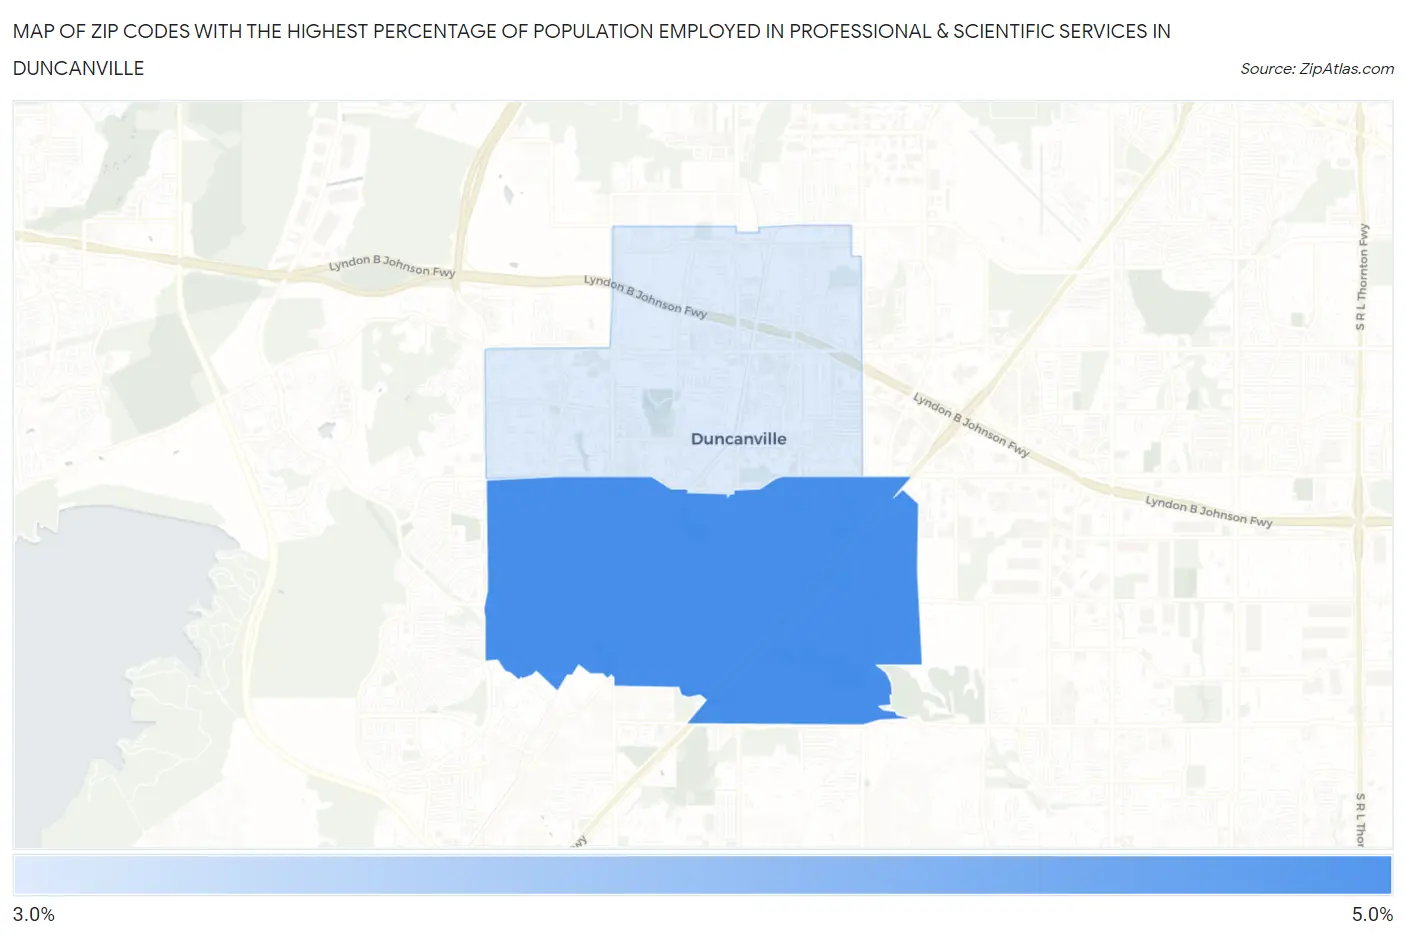
Map of Zip Codes with the Highest Percentage of Population Employed in Professional & Scientific Services in Duncanville
0.0%
5.0%
Zip Codes with the Highest Percentage of Population Employed in Professional & Scientific Services in Duncanville, TX
| Zip Code | % Employed | vs State | vs National | |
| 1. | 75137 | 4.9% | 7.6%(-2.70)#715 | 7.8%(-2.95)#12,579 |
| 2. | 75116 | 3.7% | 7.6%(-3.87)#938 | 7.8%(-4.11)#15,941 |
1
Common Questions
What are the Top Zip Codes with the Highest Percentage of Population Employed in Professional & Scientific Services in Duncanville, TX?
Top Zip Codes with the Highest Percentage of Population Employed in Professional & Scientific Services in Duncanville, TX are:
What zip code has the Highest Percentage of Population Employed in Professional & Scientific Services in Duncanville, TX?
75137 has the Highest Percentage of Population Employed in Professional & Scientific Services in Duncanville, TX with 4.9%.
What is the Percentage of Population Employed in Professional & Scientific Services in Duncanville, TX?
Percentage of Population Employed in Professional & Scientific Services in Duncanville is 4.4%.
What is the Percentage of Population Employed in Professional & Scientific Services in Texas?
Percentage of Population Employed in Professional & Scientific Services in Texas is 7.6%.
What is the Percentage of Population Employed in Professional & Scientific Services in the United States?
Percentage of Population Employed in Professional & Scientific Services in the United States is 7.8%.