Zip Codes with the Highest Percentage of Population Employed in Agriculture, Fishing & Hunting in Denison, TX
RELATED REPORTS & OPTIONS
Agriculture, Fishing & Hunting
Denison
Compare Zip Codes
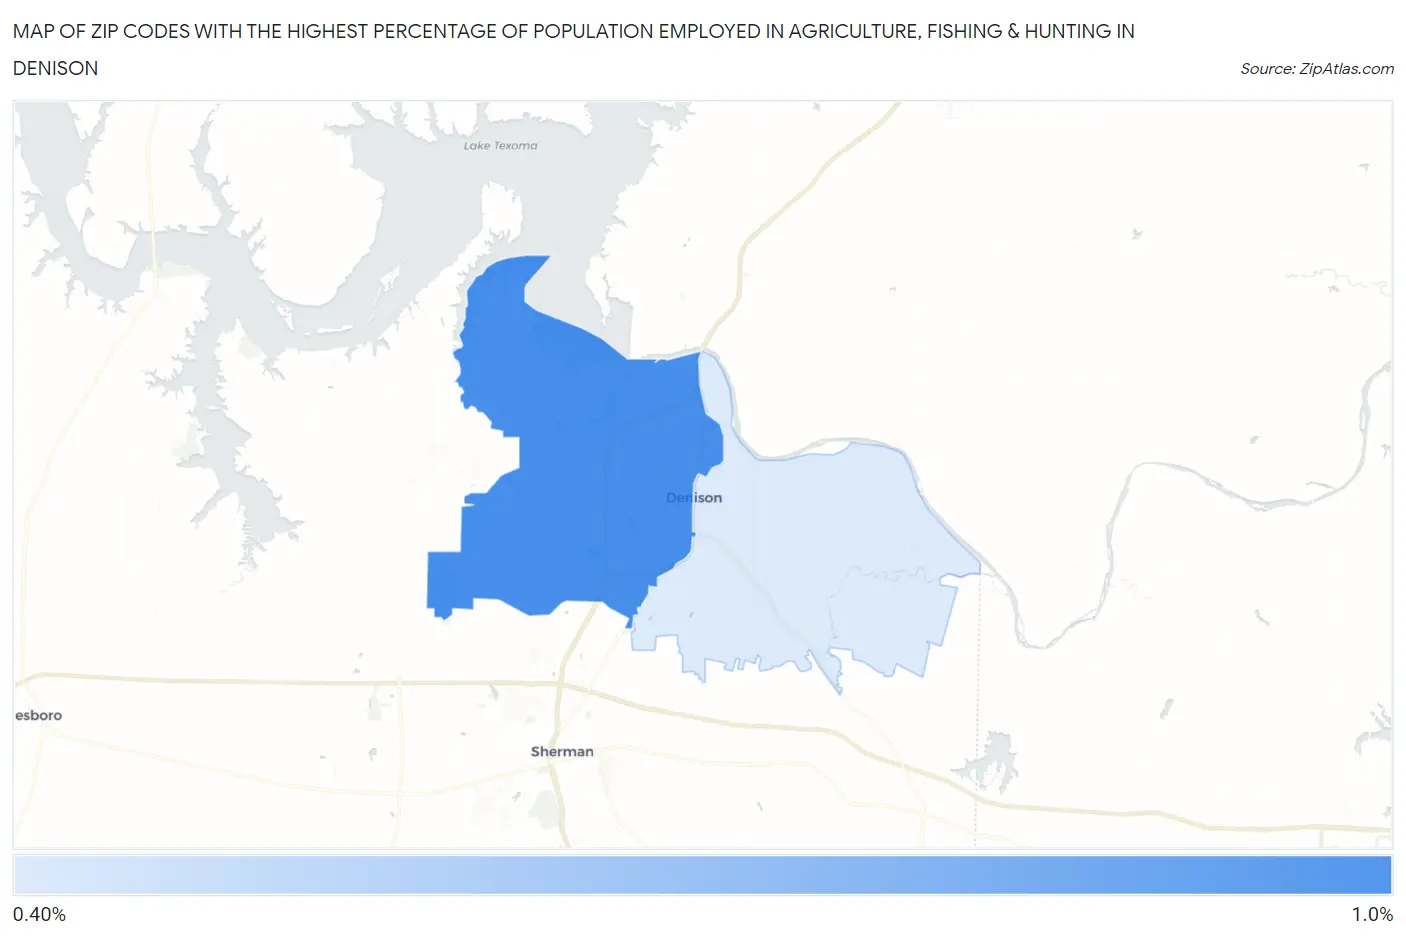
Map of Zip Codes with the Highest Percentage of Population Employed in Agriculture, Fishing & Hunting in Denison
0.0%
1.0%
Zip Codes with the Highest Percentage of Population Employed in Agriculture, Fishing & Hunting in Denison, TX
| Zip Code | % Employed | vs State | vs National | |
| 1. | 75020 | 0.98% | 0.75%(+0.224)#860 | 1.2%(-0.224)#16,335 |
| 2. | 75021 | 0.42% | 0.75%(-0.331)#1,079 | 1.2%(-0.779)#19,970 |
1
Common Questions
What are the Top Zip Codes with the Highest Percentage of Population Employed in Agriculture, Fishing & Hunting in Denison, TX?
Top Zip Codes with the Highest Percentage of Population Employed in Agriculture, Fishing & Hunting in Denison, TX are:
What zip code has the Highest Percentage of Population Employed in Agriculture, Fishing & Hunting in Denison, TX?
75020 has the Highest Percentage of Population Employed in Agriculture, Fishing & Hunting in Denison, TX with 0.98%.
What is the Percentage of Population Employed in Agriculture, Fishing & Hunting in Denison, TX?
Percentage of Population Employed in Agriculture, Fishing & Hunting in Denison is 0.94%.
What is the Percentage of Population Employed in Agriculture, Fishing & Hunting in Texas?
Percentage of Population Employed in Agriculture, Fishing & Hunting in Texas is 0.75%.
What is the Percentage of Population Employed in Agriculture, Fishing & Hunting in the United States?
Percentage of Population Employed in Agriculture, Fishing & Hunting in the United States is 1.2%.