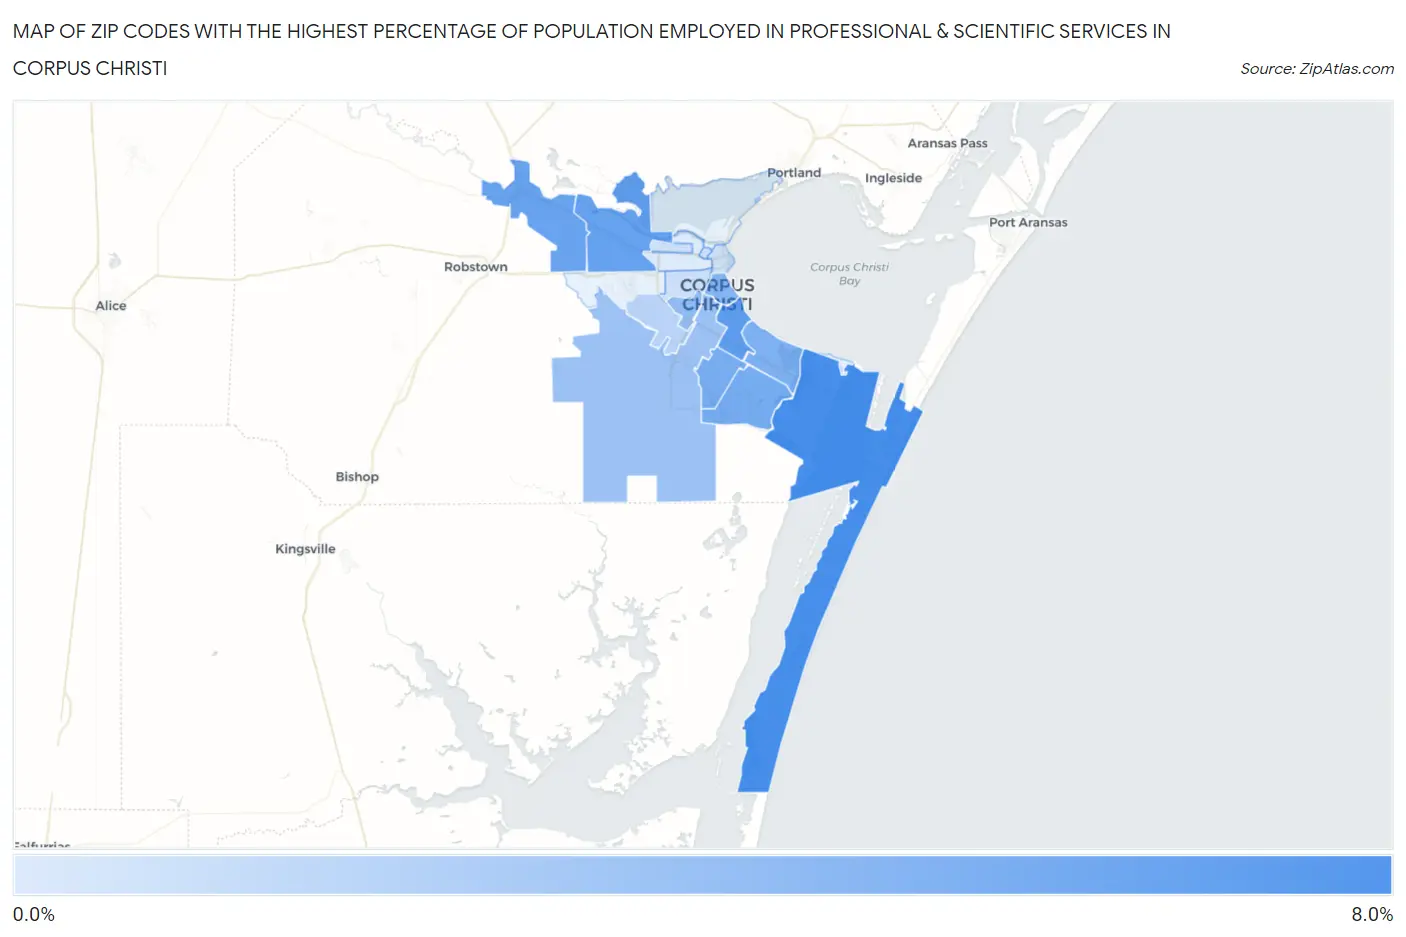
Zip Codes with the Highest Percentage of Population Employed in Professional & Scientific Services in Corpus Christi, TX
RELATED REPORTS & OPTIONS
Professional & Scientific Services
Corpus Christi
Compare Zip Codes
Map of Zip Codes with the Highest Percentage of Population Employed in Professional & Scientific Services in Corpus Christi
0.0%
8.0%
Zip Codes with the Highest Percentage of Population Employed in Professional & Scientific Services in Corpus Christi, TX
| Zip Code | % Employed | vs State | vs National | |
| 1. | 78418 | 7.7% | 7.6%(+0.055)#381 | 7.8%(-0.192)#7,124 |
| 2. | 78411 | 6.5% | 7.6%(-1.15)#488 | 7.8%(-1.40)#9,125 |
| 3. | 78409 | 6.1% | 7.6%(-1.51)#527 | 7.8%(-1.75)#9,789 |
| 4. | 78410 | 5.9% | 7.6%(-1.66)#548 | 7.8%(-1.91)#10,092 |
| 5. | 78414 | 5.2% | 7.6%(-2.36)#665 | 7.8%(-2.61)#11,711 |
| 6. | 78413 | 5.1% | 7.6%(-2.48)#677 | 7.8%(-2.73)#12,018 |
| 7. | 78412 | 4.8% | 7.6%(-2.79)#733 | 7.8%(-3.04)#12,811 |
| 8. | 78404 | 4.5% | 7.6%(-3.09)#804 | 7.8%(-3.34)#13,632 |
| 9. | 78416 | 3.9% | 7.6%(-3.70)#914 | 7.8%(-3.95)#15,422 |
| 10. | 78415 | 3.5% | 7.6%(-4.12)#1,000 | 7.8%(-4.37)#16,785 |
| 11. | 78417 | 2.0% | 7.6%(-5.63)#1,300 | 7.8%(-5.88)#21,972 |
| 12. | 78405 | 0.98% | 7.6%(-6.62)#1,455 | 7.8%(-6.87)#25,090 |
| 13. | 78401 | 0.92% | 7.6%(-6.68)#1,464 | 7.8%(-6.93)#25,250 |
| 14. | 78407 | 0.90% | 7.6%(-6.70)#1,470 | 7.8%(-6.95)#25,291 |
| 15. | 78408 | 0.16% | 7.6%(-7.44)#1,553 | 7.8%(-7.69)#26,731 |
1
Common Questions
What are the Top 10 Zip Codes with the Highest Percentage of Population Employed in Professional & Scientific Services in Corpus Christi, TX?
Top 10 Zip Codes with the Highest Percentage of Population Employed in Professional & Scientific Services in Corpus Christi, TX are:
What zip code has the Highest Percentage of Population Employed in Professional & Scientific Services in Corpus Christi, TX?
78418 has the Highest Percentage of Population Employed in Professional & Scientific Services in Corpus Christi, TX with 7.7%.
What is the Percentage of Population Employed in Professional & Scientific Services in Corpus Christi, TX?
Percentage of Population Employed in Professional & Scientific Services in Corpus Christi is 4.8%.
What is the Percentage of Population Employed in Professional & Scientific Services in Texas?
Percentage of Population Employed in Professional & Scientific Services in Texas is 7.6%.
What is the Percentage of Population Employed in Professional & Scientific Services in the United States?
Percentage of Population Employed in Professional & Scientific Services in the United States is 7.8%.