Zip Codes with the Highest Percentage of Population Employed in Health Care & Social Assistance in Corpus Christi, TX
RELATED REPORTS & OPTIONS
Health Care & Social Assistance
Corpus Christi
Compare Zip Codes
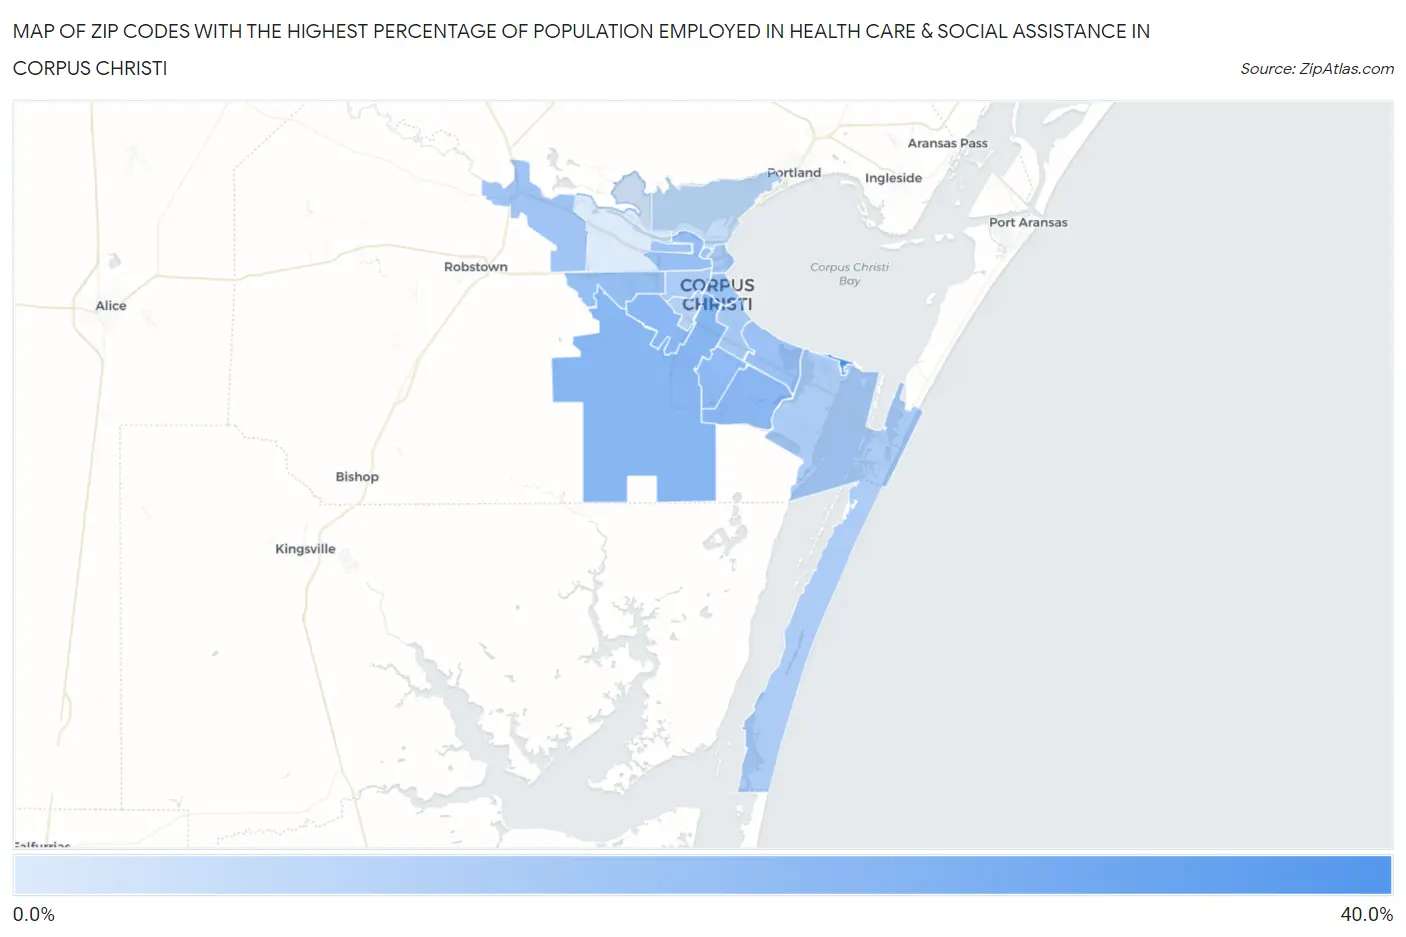
Map of Zip Codes with the Highest Percentage of Population Employed in Health Care & Social Assistance in Corpus Christi
0.0%
40.0%
Zip Codes with the Highest Percentage of Population Employed in Health Care & Social Assistance in Corpus Christi, TX
| Zip Code | % Employed | vs State | vs National | |
| 1. | 78419 | 30.3% | 11.9%(+18.3)#47 | 13.9%(+16.3)#915 |
| 2. | 78415 | 17.6% | 11.9%(+5.64)#236 | 13.9%(+3.63)#6,840 |
| 3. | 78417 | 17.2% | 11.9%(+5.29)#257 | 13.9%(+3.28)#7,367 |
| 4. | 78414 | 17.1% | 11.9%(+5.14)#266 | 13.9%(+3.13)#7,617 |
| 5. | 78413 | 16.1% | 11.9%(+4.19)#319 | 13.9%(+2.18)#9,279 |
| 6. | 78406 | 14.8% | 11.9%(+2.86)#446 | 13.9%(+0.845)#12,149 |
| 7. | 78408 | 14.3% | 11.9%(+2.41)#501 | 13.9%(+0.400)#13,246 |
| 8. | 78412 | 13.9% | 11.9%(+2.01)#545 | 13.9%(-0.003)#14,225 |
| 9. | 78407 | 13.2% | 11.9%(+1.26)#643 | 13.9%(-0.745)#16,081 |
| 10. | 78404 | 13.0% | 11.9%(+1.08)#669 | 13.9%(-0.933)#16,577 |
| 11. | 78410 | 12.8% | 11.9%(+0.860)#703 | 13.9%(-1.15)#17,118 |
| 12. | 78401 | 12.1% | 11.9%(+0.208)#778 | 13.9%(-1.80)#18,721 |
| 13. | 78411 | 11.5% | 11.9%(-0.453)#890 | 13.9%(-2.46)#20,277 |
| 14. | 78405 | 10.7% | 11.9%(-1.23)#1,009 | 13.9%(-3.24)#22,030 |
| 15. | 78418 | 10.5% | 11.9%(-1.44)#1,050 | 13.9%(-3.45)#22,464 |
| 16. | 78416 | 9.2% | 11.9%(-2.77)#1,252 | 13.9%(-4.78)#24,934 |
| 17. | 78402 | 6.7% | 11.9%(-5.19)#1,530 | 13.9%(-7.20)#27,754 |
| 18. | 78409 | 2.4% | 11.9%(-9.52)#1,719 | 13.9%(-11.5)#30,201 |
1
Common Questions
What are the Top 10 Zip Codes with the Highest Percentage of Population Employed in Health Care & Social Assistance in Corpus Christi, TX?
Top 10 Zip Codes with the Highest Percentage of Population Employed in Health Care & Social Assistance in Corpus Christi, TX are:
What zip code has the Highest Percentage of Population Employed in Health Care & Social Assistance in Corpus Christi, TX?
78419 has the Highest Percentage of Population Employed in Health Care & Social Assistance in Corpus Christi, TX with 30.3%.
What is the Percentage of Population Employed in Health Care & Social Assistance in Corpus Christi, TX?
Percentage of Population Employed in Health Care & Social Assistance in Corpus Christi is 14.1%.
What is the Percentage of Population Employed in Health Care & Social Assistance in Texas?
Percentage of Population Employed in Health Care & Social Assistance in Texas is 11.9%.
What is the Percentage of Population Employed in Health Care & Social Assistance in the United States?
Percentage of Population Employed in Health Care & Social Assistance in the United States is 13.9%.