Zip Codes with the Highest Percentage of Population Employed in Farming, Fishing & Forestry in Corpus Christi, TX
RELATED REPORTS & OPTIONS
Farming, Fishing & Forestry
Corpus Christi
Compare Zip Codes
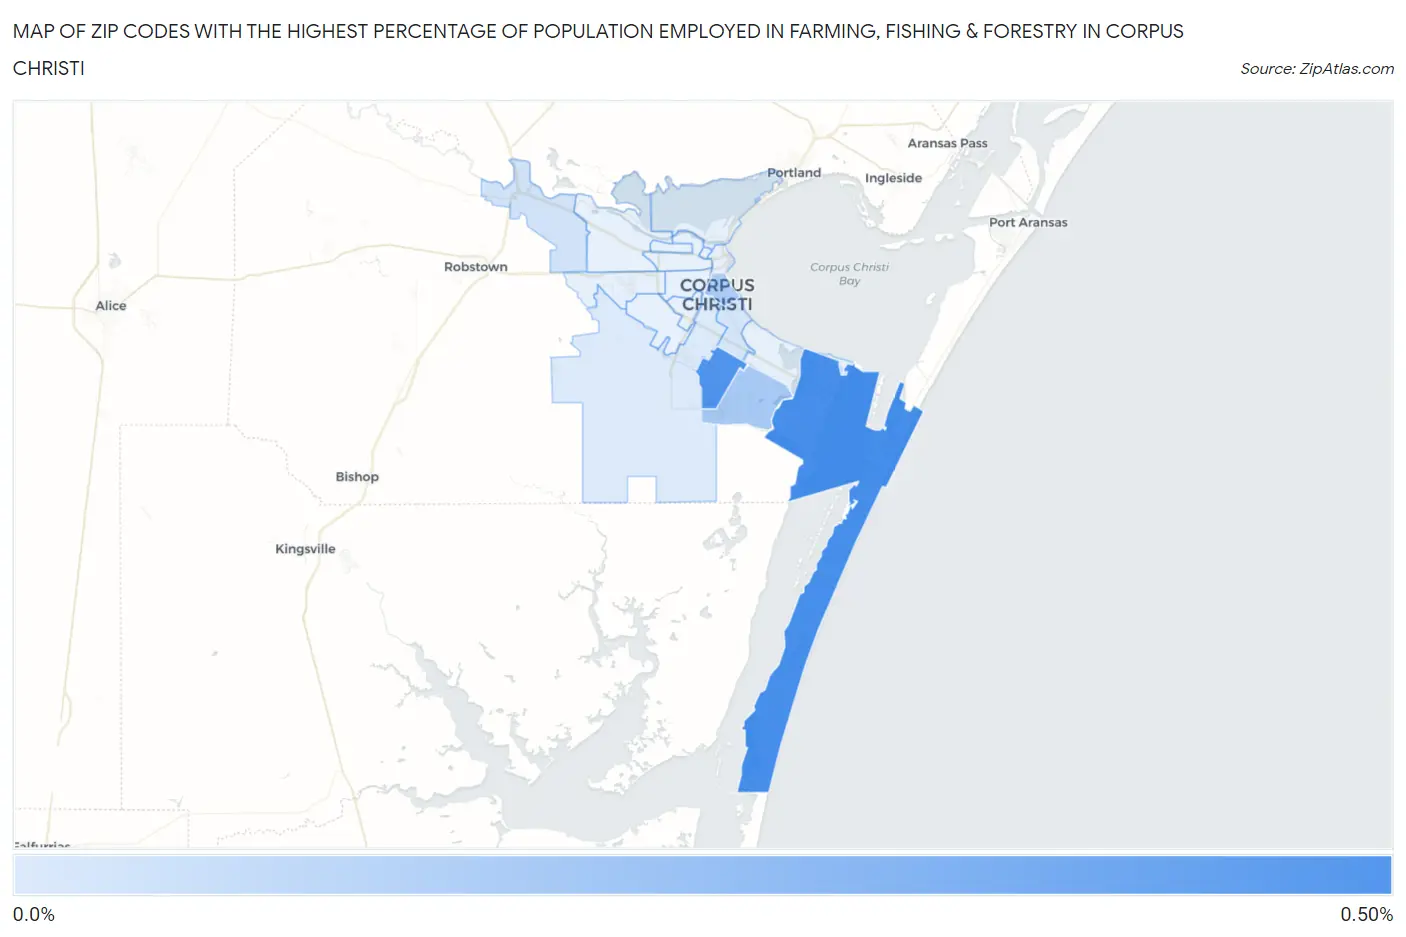
Map of Zip Codes with the Highest Percentage of Population Employed in Farming, Fishing & Forestry in Corpus Christi
0.0%
0.50%
Zip Codes with the Highest Percentage of Population Employed in Farming, Fishing & Forestry in Corpus Christi, TX
| Zip Code | % Employed | vs State | vs National | |
| 1. | 78418 | 0.45% | 0.37%(+0.083)#697 | 0.61%(-0.151)#13,246 |
| 2. | 78413 | 0.44% | 0.37%(+0.067)#703 | 0.61%(-0.166)#13,392 |
| 3. | 78414 | 0.22% | 0.37%(-0.153)#863 | 0.61%(-0.386)#15,849 |
| 4. | 78404 | 0.20% | 0.37%(-0.171)#883 | 0.61%(-0.404)#16,113 |
| 5. | 78410 | 0.12% | 0.37%(-0.256)#967 | 0.61%(-0.489)#17,488 |
| 6. | 78411 | 0.10% | 0.37%(-0.268)#985 | 0.61%(-0.502)#17,686 |
| 7. | 78415 | 0.089% | 0.37%(-0.283)#999 | 0.61%(-0.516)#17,944 |
1
Common Questions
What are the Top 10 Zip Codes with the Highest Percentage of Population Employed in Farming, Fishing & Forestry in Corpus Christi, TX?
Top 10 Zip Codes with the Highest Percentage of Population Employed in Farming, Fishing & Forestry in Corpus Christi, TX are:
What zip code has the Highest Percentage of Population Employed in Farming, Fishing & Forestry in Corpus Christi, TX?
78418 has the Highest Percentage of Population Employed in Farming, Fishing & Forestry in Corpus Christi, TX with 0.45%.
What is the Percentage of Population Employed in Farming, Fishing & Forestry in Corpus Christi, TX?
Percentage of Population Employed in Farming, Fishing & Forestry in Corpus Christi is 0.17%.
What is the Percentage of Population Employed in Farming, Fishing & Forestry in Texas?
Percentage of Population Employed in Farming, Fishing & Forestry in Texas is 0.37%.
What is the Percentage of Population Employed in Farming, Fishing & Forestry in the United States?
Percentage of Population Employed in Farming, Fishing & Forestry in the United States is 0.61%.