Zip Codes with the Highest Percentage of Population Employed in Farming, Fishing & Forestry in College Station, TX
RELATED REPORTS & OPTIONS
Farming, Fishing & Forestry
College Station
Compare Zip Codes
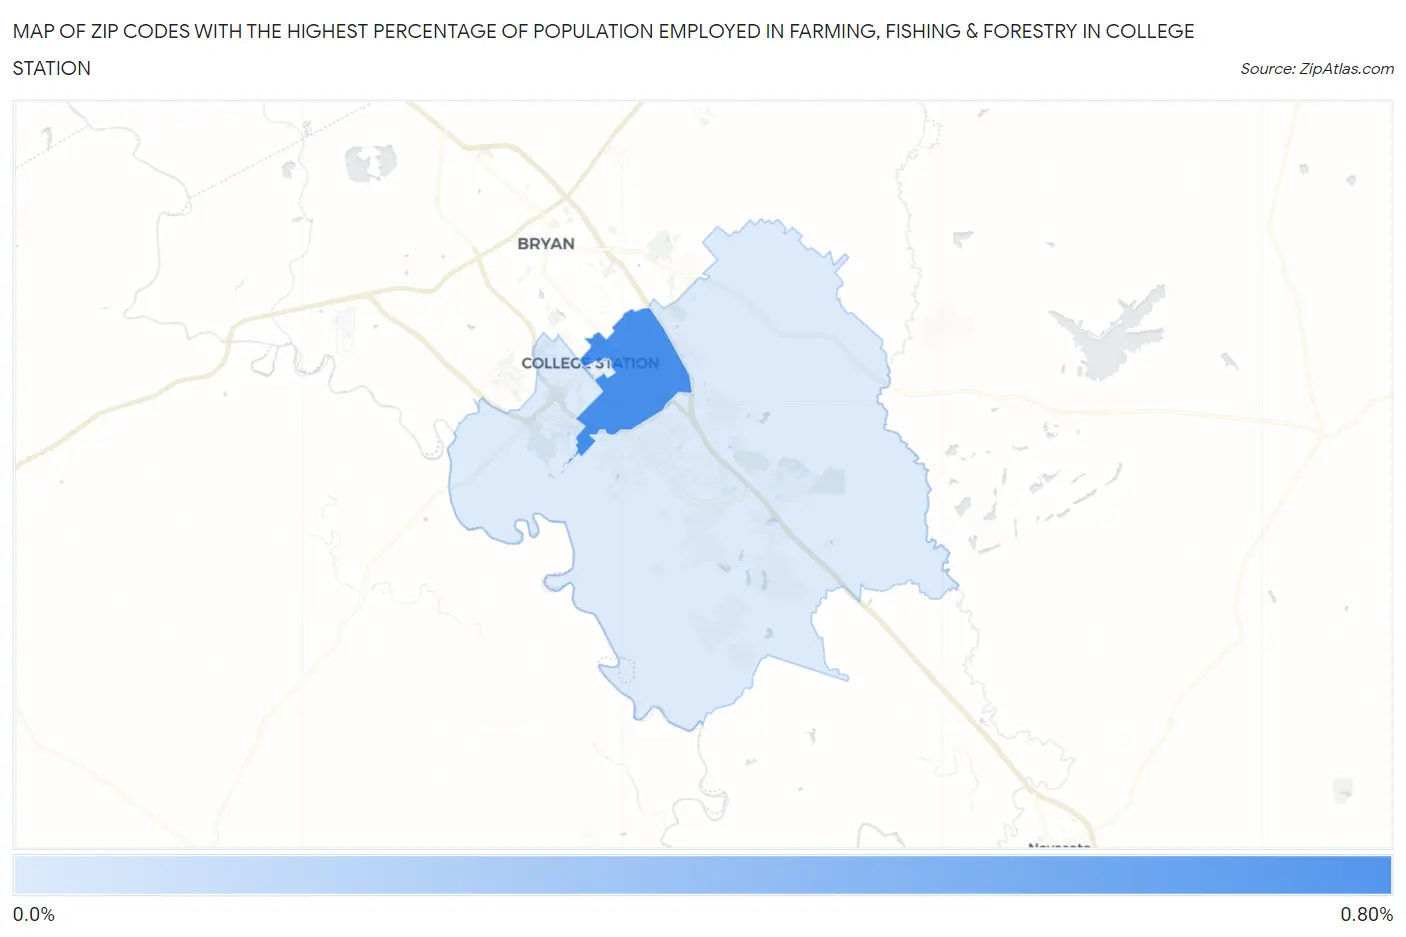
Map of Zip Codes with the Highest Percentage of Population Employed in Farming, Fishing & Forestry in College Station
0.0%
0.80%
Zip Codes with the Highest Percentage of Population Employed in Farming, Fishing & Forestry in College Station, TX
| Zip Code | % Employed | vs State | vs National | |
| 1. | 77840 | 0.71% | 0.37%(+0.335)#604 | 0.61%(+0.102)#11,337 |
| 2. | 77845 | 0.14% | 0.37%(-0.228)#941 | 0.61%(-0.462)#17,027 |
1
Common Questions
What are the Top Zip Codes with the Highest Percentage of Population Employed in Farming, Fishing & Forestry in College Station, TX?
Top Zip Codes with the Highest Percentage of Population Employed in Farming, Fishing & Forestry in College Station, TX are:
What zip code has the Highest Percentage of Population Employed in Farming, Fishing & Forestry in College Station, TX?
77840 has the Highest Percentage of Population Employed in Farming, Fishing & Forestry in College Station, TX with 0.71%.
What is the Percentage of Population Employed in Farming, Fishing & Forestry in College Station, TX?
Percentage of Population Employed in Farming, Fishing & Forestry in College Station is 0.40%.
What is the Percentage of Population Employed in Farming, Fishing & Forestry in Texas?
Percentage of Population Employed in Farming, Fishing & Forestry in Texas is 0.37%.
What is the Percentage of Population Employed in Farming, Fishing & Forestry in the United States?
Percentage of Population Employed in Farming, Fishing & Forestry in the United States is 0.61%.