Zip Codes with the Highest Percentage of Population Employed in Health Care & Social Assistance in Brownsville, TX
RELATED REPORTS & OPTIONS
Health Care & Social Assistance
Brownsville
Compare Zip Codes
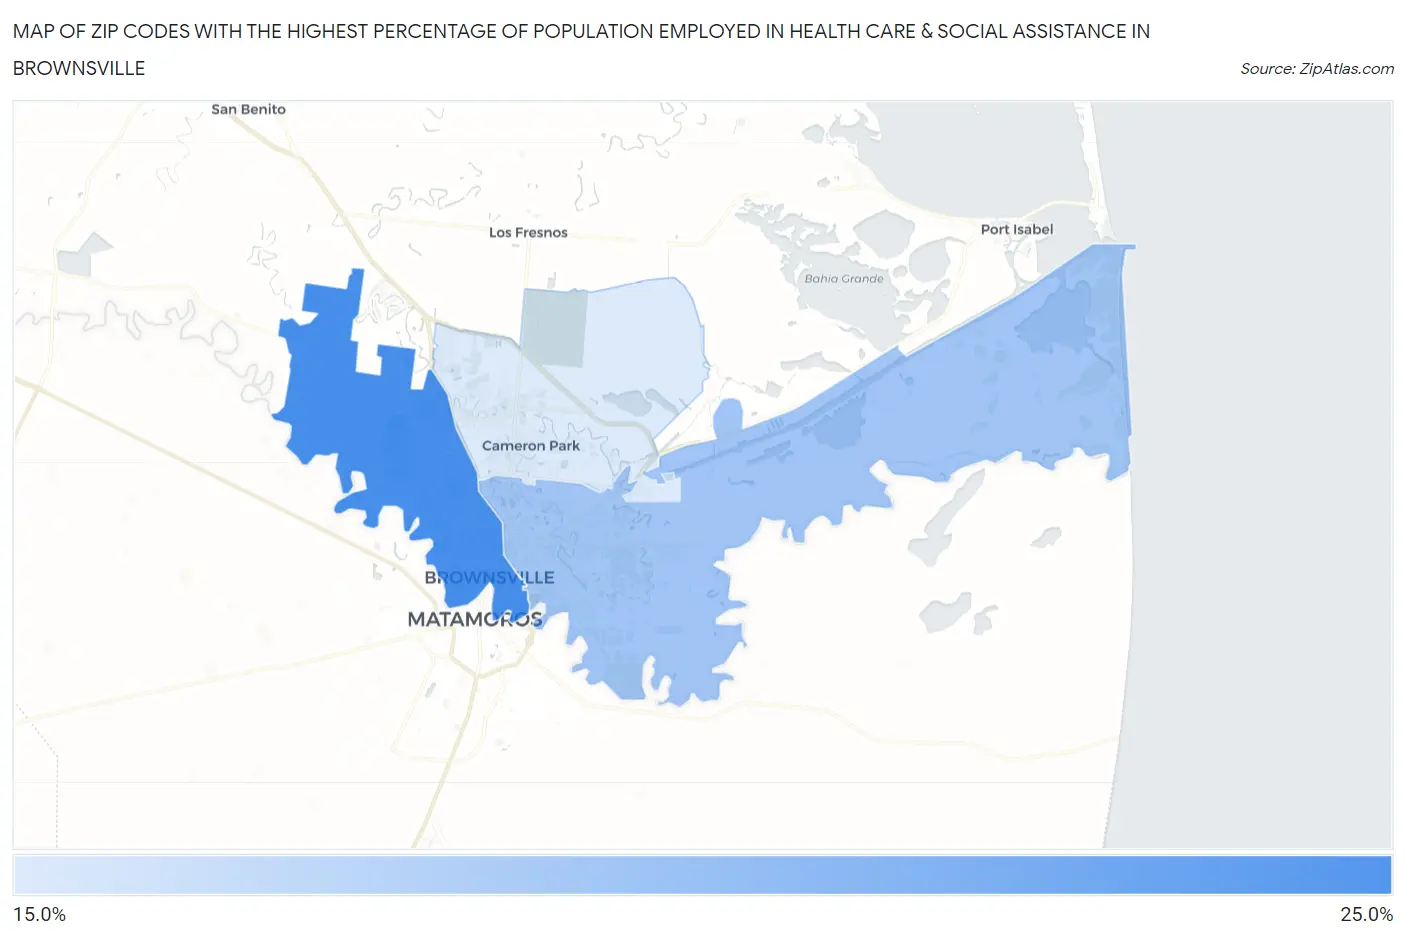
Map of Zip Codes with the Highest Percentage of Population Employed in Health Care & Social Assistance in Brownsville
0.0%
25.0%
Zip Codes with the Highest Percentage of Population Employed in Health Care & Social Assistance in Brownsville, TX
| Zip Code | % Employed | vs State | vs National | |
| 1. | 78520 | 20.3% | 11.9%(+8.40)#146 | 13.9%(+6.39)#3,839 |
| 2. | 78521 | 18.1% | 11.9%(+6.13)#217 | 13.9%(+4.12)#6,110 |
| 3. | 78526 | 16.6% | 11.9%(+4.67)#290 | 13.9%(+2.66)#8,377 |
1
Common Questions
What are the Top Zip Codes with the Highest Percentage of Population Employed in Health Care & Social Assistance in Brownsville, TX?
Top Zip Codes with the Highest Percentage of Population Employed in Health Care & Social Assistance in Brownsville, TX are:
What zip code has the Highest Percentage of Population Employed in Health Care & Social Assistance in Brownsville, TX?
78520 has the Highest Percentage of Population Employed in Health Care & Social Assistance in Brownsville, TX with 20.3%.
What is the Percentage of Population Employed in Health Care & Social Assistance in Brownsville, TX?
Percentage of Population Employed in Health Care & Social Assistance in Brownsville is 18.6%.
What is the Percentage of Population Employed in Health Care & Social Assistance in Texas?
Percentage of Population Employed in Health Care & Social Assistance in Texas is 11.9%.
What is the Percentage of Population Employed in Health Care & Social Assistance in the United States?
Percentage of Population Employed in Health Care & Social Assistance in the United States is 13.9%.