Zip Codes with the Highest Percentage of Population Employed in Agriculture, Fishing & Hunting in Brownsville, TX
RELATED REPORTS & OPTIONS
Agriculture, Fishing & Hunting
Brownsville
Compare Zip Codes
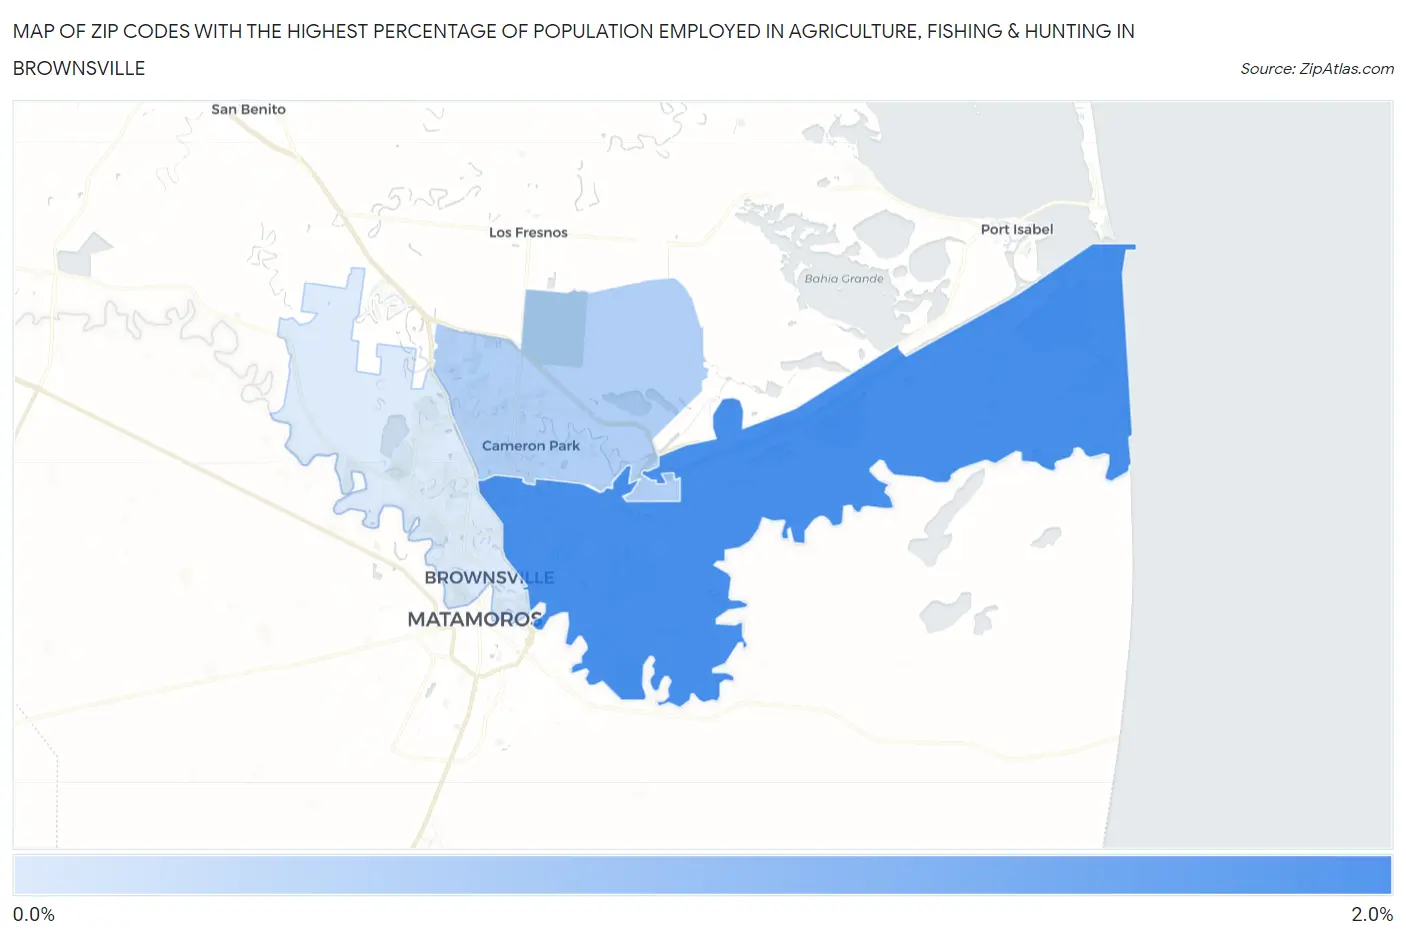
Map of Zip Codes with the Highest Percentage of Population Employed in Agriculture, Fishing & Hunting in Brownsville
0.0%
2.0%
Zip Codes with the Highest Percentage of Population Employed in Agriculture, Fishing & Hunting in Brownsville, TX
| Zip Code | % Employed | vs State | vs National | |
| 1. | 78521 | 1.6% | 0.75%(+0.805)#739 | 1.2%(+0.357)#14,103 |
| 2. | 78526 | 0.57% | 0.75%(-0.178)#1,006 | 1.2%(-0.626)#18,672 |
| 3. | 78520 | 0.17% | 0.75%(-0.578)#1,266 | 1.2%(-1.03)#22,671 |
1
Common Questions
What are the Top Zip Codes with the Highest Percentage of Population Employed in Agriculture, Fishing & Hunting in Brownsville, TX?
Top Zip Codes with the Highest Percentage of Population Employed in Agriculture, Fishing & Hunting in Brownsville, TX are:
What zip code has the Highest Percentage of Population Employed in Agriculture, Fishing & Hunting in Brownsville, TX?
78521 has the Highest Percentage of Population Employed in Agriculture, Fishing & Hunting in Brownsville, TX with 1.6%.
What is the Percentage of Population Employed in Agriculture, Fishing & Hunting in Brownsville, TX?
Percentage of Population Employed in Agriculture, Fishing & Hunting in Brownsville is 0.65%.
What is the Percentage of Population Employed in Agriculture, Fishing & Hunting in Texas?
Percentage of Population Employed in Agriculture, Fishing & Hunting in Texas is 0.75%.
What is the Percentage of Population Employed in Agriculture, Fishing & Hunting in the United States?
Percentage of Population Employed in Agriculture, Fishing & Hunting in the United States is 1.2%.