Zip Codes with the Highest Percentage of Population Employed in Agriculture, Fishing & Hunting in Beaumont, TX
RELATED REPORTS & OPTIONS
Agriculture, Fishing & Hunting
Beaumont
Compare Zip Codes
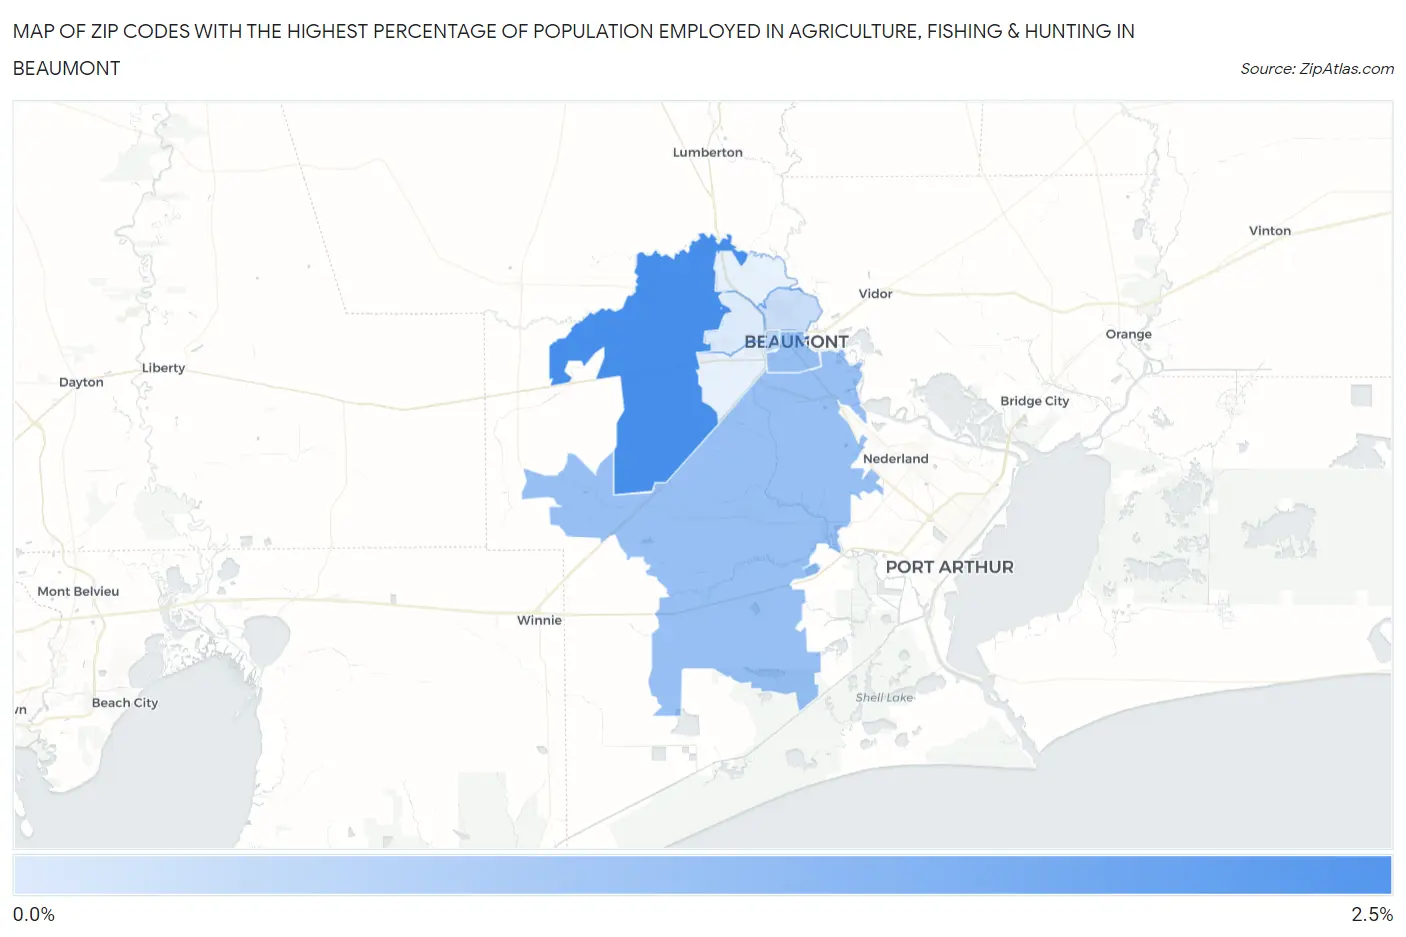
Map of Zip Codes with the Highest Percentage of Population Employed in Agriculture, Fishing & Hunting in Beaumont
0.0%
2.5%
Zip Codes with the Highest Percentage of Population Employed in Agriculture, Fishing & Hunting in Beaumont, TX
| Zip Code | % Employed | vs State | vs National | |
| 1. | 77713 | 2.1% | 0.75%(+1.32)#657 | 1.2%(+0.873)#12,571 |
| 2. | 77701 | 1.0% | 0.75%(+0.264)#848 | 1.2%(-0.184)#16,147 |
| 3. | 77705 | 0.99% | 0.75%(+0.240)#856 | 1.2%(-0.208)#16,266 |
| 4. | 77702 | 0.58% | 0.75%(-0.171)#1,003 | 1.2%(-0.618)#18,620 |
| 5. | 77703 | 0.37% | 0.75%(-0.377)#1,110 | 1.2%(-0.825)#20,390 |
| 6. | 77706 | 0.090% | 0.75%(-0.662)#1,367 | 1.2%(-1.11)#23,828 |
1
Common Questions
What are the Top 5 Zip Codes with the Highest Percentage of Population Employed in Agriculture, Fishing & Hunting in Beaumont, TX?
Top 5 Zip Codes with the Highest Percentage of Population Employed in Agriculture, Fishing & Hunting in Beaumont, TX are:
What zip code has the Highest Percentage of Population Employed in Agriculture, Fishing & Hunting in Beaumont, TX?
77713 has the Highest Percentage of Population Employed in Agriculture, Fishing & Hunting in Beaumont, TX with 2.1%.
What is the Percentage of Population Employed in Agriculture, Fishing & Hunting in Beaumont, TX?
Percentage of Population Employed in Agriculture, Fishing & Hunting in Beaumont is 0.36%.
What is the Percentage of Population Employed in Agriculture, Fishing & Hunting in Texas?
Percentage of Population Employed in Agriculture, Fishing & Hunting in Texas is 0.75%.
What is the Percentage of Population Employed in Agriculture, Fishing & Hunting in the United States?
Percentage of Population Employed in Agriculture, Fishing & Hunting in the United States is 1.2%.