Zip Codes with the Highest Percentage of Population Employed in Agriculture, Fishing & Hunting in Austin, TX
RELATED REPORTS & OPTIONS
Agriculture, Fishing & Hunting
Austin
Compare Zip Codes
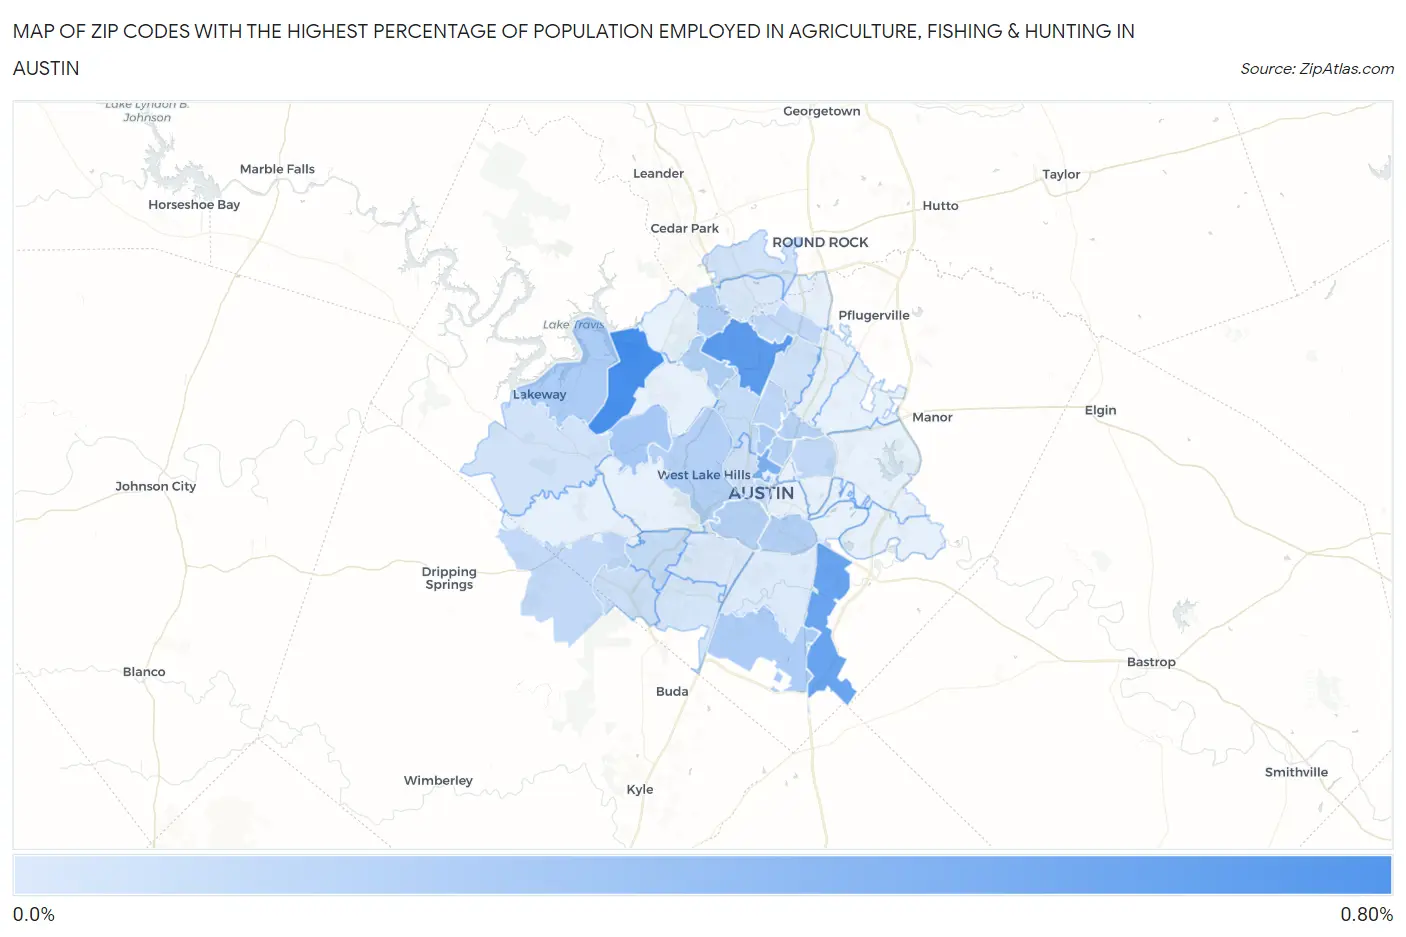
Map of Zip Codes with the Highest Percentage of Population Employed in Agriculture, Fishing & Hunting in Austin
0.0%
0.80%
Zip Codes with the Highest Percentage of Population Employed in Agriculture, Fishing & Hunting in Austin, TX
| Zip Code | % Employed | vs State | vs National | |
| 1. | 78732 | 0.77% | 0.75%(+0.022)#926 | 1.2%(-0.426)#17,400 |
| 2. | 78759 | 0.67% | 0.75%(-0.080)#957 | 1.2%(-0.528)#18,019 |
| 3. | 78719 | 0.60% | 0.75%(-0.149)#990 | 1.2%(-0.597)#18,472 |
| 4. | 78705 | 0.52% | 0.75%(-0.234)#1,036 | 1.2%(-0.682)#19,127 |
| 5. | 78733 | 0.31% | 0.75%(-0.439)#1,146 | 1.2%(-0.886)#21,032 |
| 6. | 78756 | 0.30% | 0.75%(-0.454)#1,157 | 1.2%(-0.902)#21,207 |
| 7. | 78734 | 0.28% | 0.75%(-0.473)#1,172 | 1.2%(-0.920)#21,428 |
| 8. | 78747 | 0.28% | 0.75%(-0.476)#1,173 | 1.2%(-0.924)#21,467 |
| 9. | 78750 | 0.25% | 0.75%(-0.506)#1,194 | 1.2%(-0.954)#21,815 |
| 10. | 78746 | 0.24% | 0.75%(-0.510)#1,198 | 1.2%(-0.958)#21,857 |
| 11. | 78741 | 0.24% | 0.75%(-0.511)#1,200 | 1.2%(-0.958)#21,868 |
| 12. | 78704 | 0.23% | 0.75%(-0.517)#1,205 | 1.2%(-0.965)#21,933 |
| 13. | 78752 | 0.23% | 0.75%(-0.517)#1,206 | 1.2%(-0.965)#21,936 |
| 14. | 78751 | 0.23% | 0.75%(-0.522)#1,212 | 1.2%(-0.970)#21,994 |
| 15. | 78757 | 0.19% | 0.75%(-0.561)#1,251 | 1.2%(-1.01)#22,466 |
| 16. | 78737 | 0.18% | 0.75%(-0.574)#1,261 | 1.2%(-1.02)#22,623 |
| 17. | 78723 | 0.18% | 0.75%(-0.575)#1,264 | 1.2%(-1.02)#22,637 |
| 18. | 78727 | 0.17% | 0.75%(-0.579)#1,269 | 1.2%(-1.03)#22,681 |
| 19. | 78701 | 0.17% | 0.75%(-0.584)#1,277 | 1.2%(-1.03)#22,764 |
| 20. | 78749 | 0.16% | 0.75%(-0.596)#1,294 | 1.2%(-1.04)#22,931 |
| 21. | 78731 | 0.15% | 0.75%(-0.601)#1,300 | 1.2%(-1.05)#23,013 |
| 22. | 78739 | 0.12% | 0.75%(-0.632)#1,331 | 1.2%(-1.08)#23,418 |
| 23. | 78758 | 0.11% | 0.75%(-0.644)#1,341 | 1.2%(-1.09)#23,564 |
| 24. | 78703 | 0.092% | 0.75%(-0.659)#1,364 | 1.2%(-1.11)#23,788 |
| 25. | 78738 | 0.091% | 0.75%(-0.661)#1,365 | 1.2%(-1.11)#23,812 |
| 26. | 78717 | 0.091% | 0.75%(-0.661)#1,366 | 1.2%(-1.11)#23,815 |
| 27. | 78748 | 0.067% | 0.75%(-0.685)#1,408 | 1.2%(-1.13)#24,140 |
| 28. | 78729 | 0.065% | 0.75%(-0.686)#1,411 | 1.2%(-1.13)#24,169 |
| 29. | 78745 | 0.047% | 0.75%(-0.705)#1,433 | 1.2%(-1.15)#24,383 |
| 30. | 78744 | 0.038% | 0.75%(-0.713)#1,441 | 1.2%(-1.16)#24,470 |
1
Common Questions
What are the Top 10 Zip Codes with the Highest Percentage of Population Employed in Agriculture, Fishing & Hunting in Austin, TX?
Top 10 Zip Codes with the Highest Percentage of Population Employed in Agriculture, Fishing & Hunting in Austin, TX are:
What zip code has the Highest Percentage of Population Employed in Agriculture, Fishing & Hunting in Austin, TX?
78732 has the Highest Percentage of Population Employed in Agriculture, Fishing & Hunting in Austin, TX with 0.77%.
What is the Percentage of Population Employed in Agriculture, Fishing & Hunting in Austin, TX?
Percentage of Population Employed in Agriculture, Fishing & Hunting in Austin is 0.16%.
What is the Percentage of Population Employed in Agriculture, Fishing & Hunting in Texas?
Percentage of Population Employed in Agriculture, Fishing & Hunting in Texas is 0.75%.
What is the Percentage of Population Employed in Agriculture, Fishing & Hunting in the United States?
Percentage of Population Employed in Agriculture, Fishing & Hunting in the United States is 1.2%.