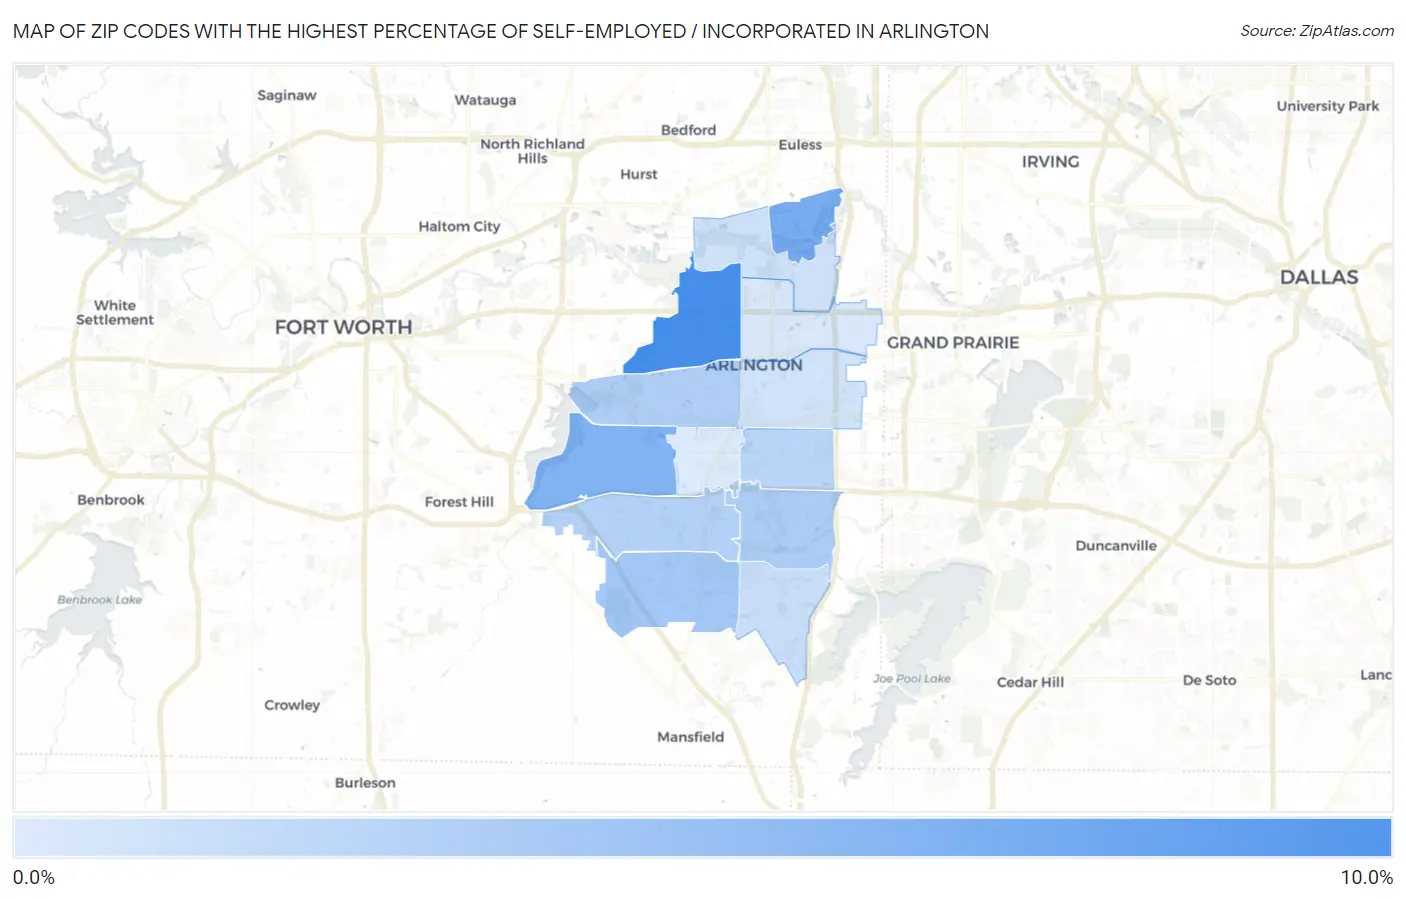
Zip Codes with the Highest Percentage of Self-Employed / Incorporated in Arlington, TX
RELATED REPORTS & OPTIONS
Self-Employed / Incorporated
Arlington
Compare Zip Codes
Map of Zip Codes with the Highest Percentage of Self-Employed / Incorporated in Arlington
1.2%
8.4%
Zip Codes with the Highest Percentage of Self-Employed / Incorporated in Arlington, TX
| Zip Code | % Self-Employed / Incorporated | vs State | vs National | |
| 1. | 76012 | 8.4% | 3.4%(+4.98)#129 | 3.8%(+4.53)#3,353 |
| 2. | 76005 | 5.9% | 3.4%(+2.56)#252 | 3.8%(+2.11)#6,471 |
| 3. | 76016 | 5.6% | 3.4%(+2.21)#291 | 3.8%(+1.76)#7,173 |
| 4. | 76001 | 3.9% | 3.4%(+0.508)#574 | 3.8%(+0.059)#12,438 |
| 5. | 76018 | 3.4% | 3.4%(+0.069)#683 | 3.8%(-0.380)#14,323 |
| 6. | 76013 | 3.3% | 3.4%(-0.036)#711 | 3.8%(-0.485)#14,818 |
| 7. | 76017 | 3.1% | 3.4%(-0.232)#776 | 3.8%(-0.681)#15,716 |
| 8. | 76014 | 2.8% | 3.4%(-0.556)#882 | 3.8%(-1.00)#17,322 |
| 9. | 76002 | 2.2% | 3.4%(-1.20)#1,085 | 3.8%(-1.65)#20,530 |
| 10. | 76006 | 1.9% | 3.4%(-1.47)#1,173 | 3.8%(-1.92)#21,828 |
| 11. | 76010 | 1.8% | 3.4%(-1.57)#1,207 | 3.8%(-2.02)#22,291 |
| 12. | 76011 | 1.4% | 3.4%(-1.96)#1,332 | 3.8%(-2.41)#23,822 |
| 13. | 76015 | 1.2% | 3.4%(-2.15)#1,385 | 3.8%(-2.60)#24,559 |
1
Common Questions
What are the Top 10 Zip Codes with the Highest Percentage of Self-Employed / Incorporated in Arlington, TX?
Top 10 Zip Codes with the Highest Percentage of Self-Employed / Incorporated in Arlington, TX are:
What zip code has the Highest Percentage of Self-Employed / Incorporated in Arlington, TX?
76012 has the Highest Percentage of Self-Employed / Incorporated in Arlington, TX with 8.4%.
What is the Percentage of Self-Employed / Incorporated in Arlington, TX?
Percentage of Self-Employed / Incorporated in Arlington is 3.2%.
What is the Percentage of Self-Employed / Incorporated in Texas?
Percentage of Self-Employed / Incorporated in Texas is 3.4%.
What is the Percentage of Self-Employed / Incorporated in the United States?
Percentage of Self-Employed / Incorporated in the United States is 3.8%.