Zip Codes with the Highest Percentage of Population Employed in Health Care & Social Assistance in Amarillo, TX
RELATED REPORTS & OPTIONS
Health Care & Social Assistance
Amarillo
Compare Zip Codes
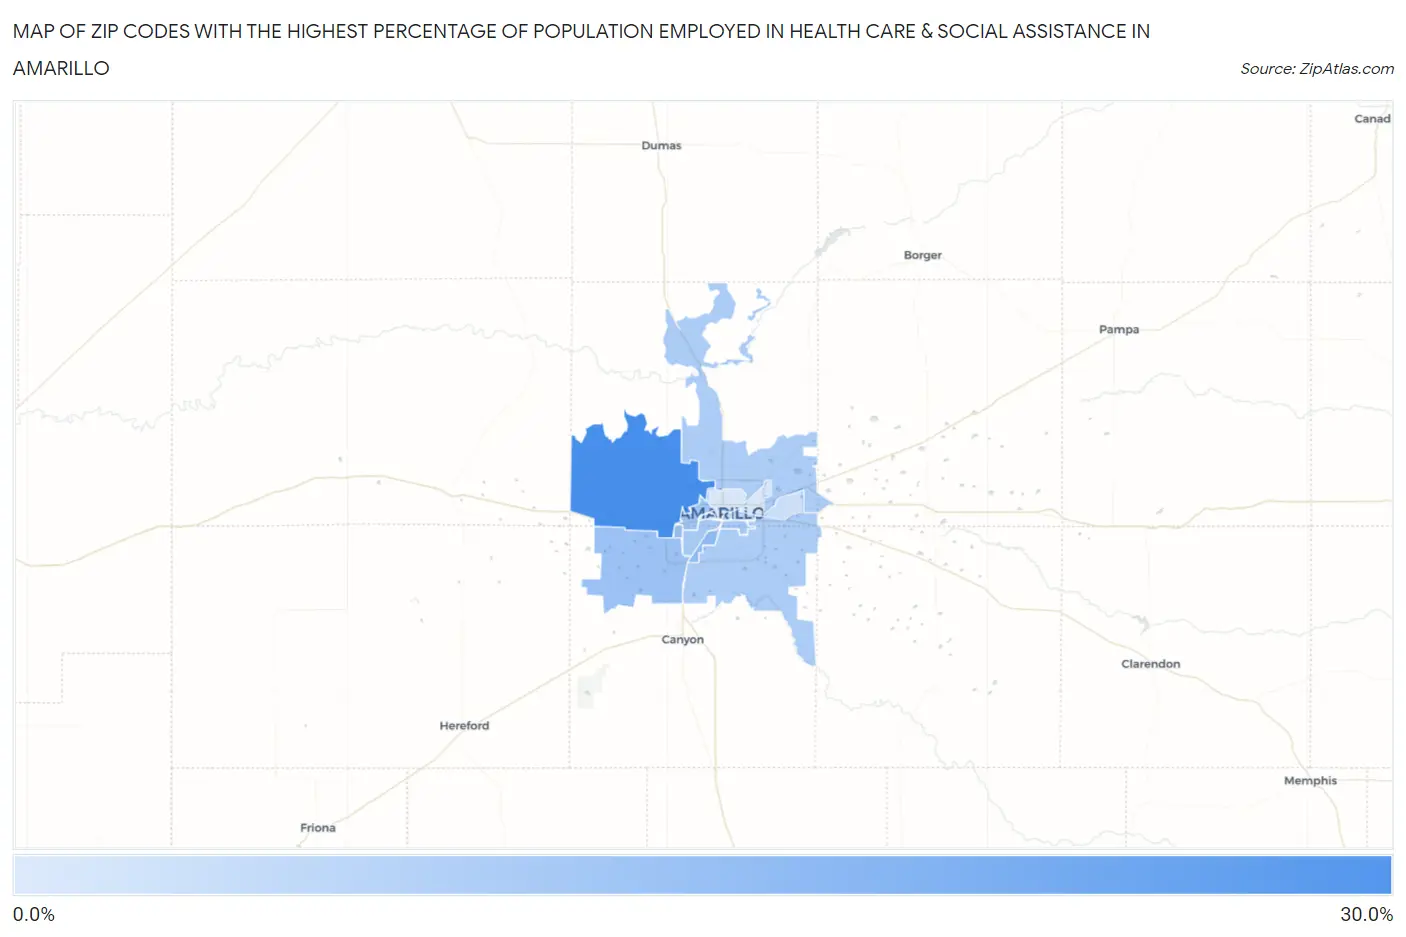
Map of Zip Codes with the Highest Percentage of Population Employed in Health Care & Social Assistance in Amarillo
0.0%
30.0%
Zip Codes with the Highest Percentage of Population Employed in Health Care & Social Assistance in Amarillo, TX
| Zip Code | % Employed | vs State | vs National | |
| 1. | 79124 | 25.7% | 11.9%(+13.8)#78 | 13.9%(+11.8)#1,565 |
| 2. | 79110 | 17.2% | 11.9%(+5.26)#258 | 13.9%(+3.25)#7,407 |
| 3. | 79121 | 16.1% | 11.9%(+4.21)#315 | 13.9%(+2.20)#9,238 |
| 4. | 79119 | 15.8% | 11.9%(+3.84)#353 | 13.9%(+1.83)#9,992 |
| 5. | 79106 | 14.8% | 11.9%(+2.83)#452 | 13.9%(+0.816)#12,224 |
| 6. | 79109 | 14.3% | 11.9%(+2.33)#512 | 13.9%(+0.315)#13,468 |
| 7. | 79103 | 14.1% | 11.9%(+2.18)#527 | 13.9%(+0.171)#13,812 |
| 8. | 79108 | 13.7% | 11.9%(+1.79)#582 | 13.9%(-0.224)#14,767 |
| 9. | 79118 | 13.6% | 11.9%(+1.70)#590 | 13.9%(-0.309)#14,968 |
| 10. | 79102 | 11.7% | 11.9%(-0.260)#864 | 13.9%(-2.27)#19,800 |
| 11. | 79104 | 11.6% | 11.9%(-0.351)#875 | 13.9%(-2.36)#20,021 |
| 12. | 79111 | 10.2% | 11.9%(-1.77)#1,104 | 13.9%(-3.78)#23,125 |
| 13. | 79107 | 8.9% | 11.9%(-3.04)#1,295 | 13.9%(-5.05)#25,343 |
| 14. | 79101 | 8.3% | 11.9%(-3.58)#1,368 | 13.9%(-5.59)#26,082 |
1
Common Questions
What are the Top 10 Zip Codes with the Highest Percentage of Population Employed in Health Care & Social Assistance in Amarillo, TX?
Top 10 Zip Codes with the Highest Percentage of Population Employed in Health Care & Social Assistance in Amarillo, TX are:
What zip code has the Highest Percentage of Population Employed in Health Care & Social Assistance in Amarillo, TX?
79124 has the Highest Percentage of Population Employed in Health Care & Social Assistance in Amarillo, TX with 25.7%.
What is the Percentage of Population Employed in Health Care & Social Assistance in Amarillo, TX?
Percentage of Population Employed in Health Care & Social Assistance in Amarillo is 14.1%.
What is the Percentage of Population Employed in Health Care & Social Assistance in Texas?
Percentage of Population Employed in Health Care & Social Assistance in Texas is 11.9%.
What is the Percentage of Population Employed in Health Care & Social Assistance in the United States?
Percentage of Population Employed in Health Care & Social Assistance in the United States is 13.9%.