Zip Codes with the Highest Percentage of Population Employed in Arts, Entertainment & Recreation in Amarillo, TX
RELATED REPORTS & OPTIONS
Arts, Entertainment & Recreation
Amarillo
Compare Zip Codes
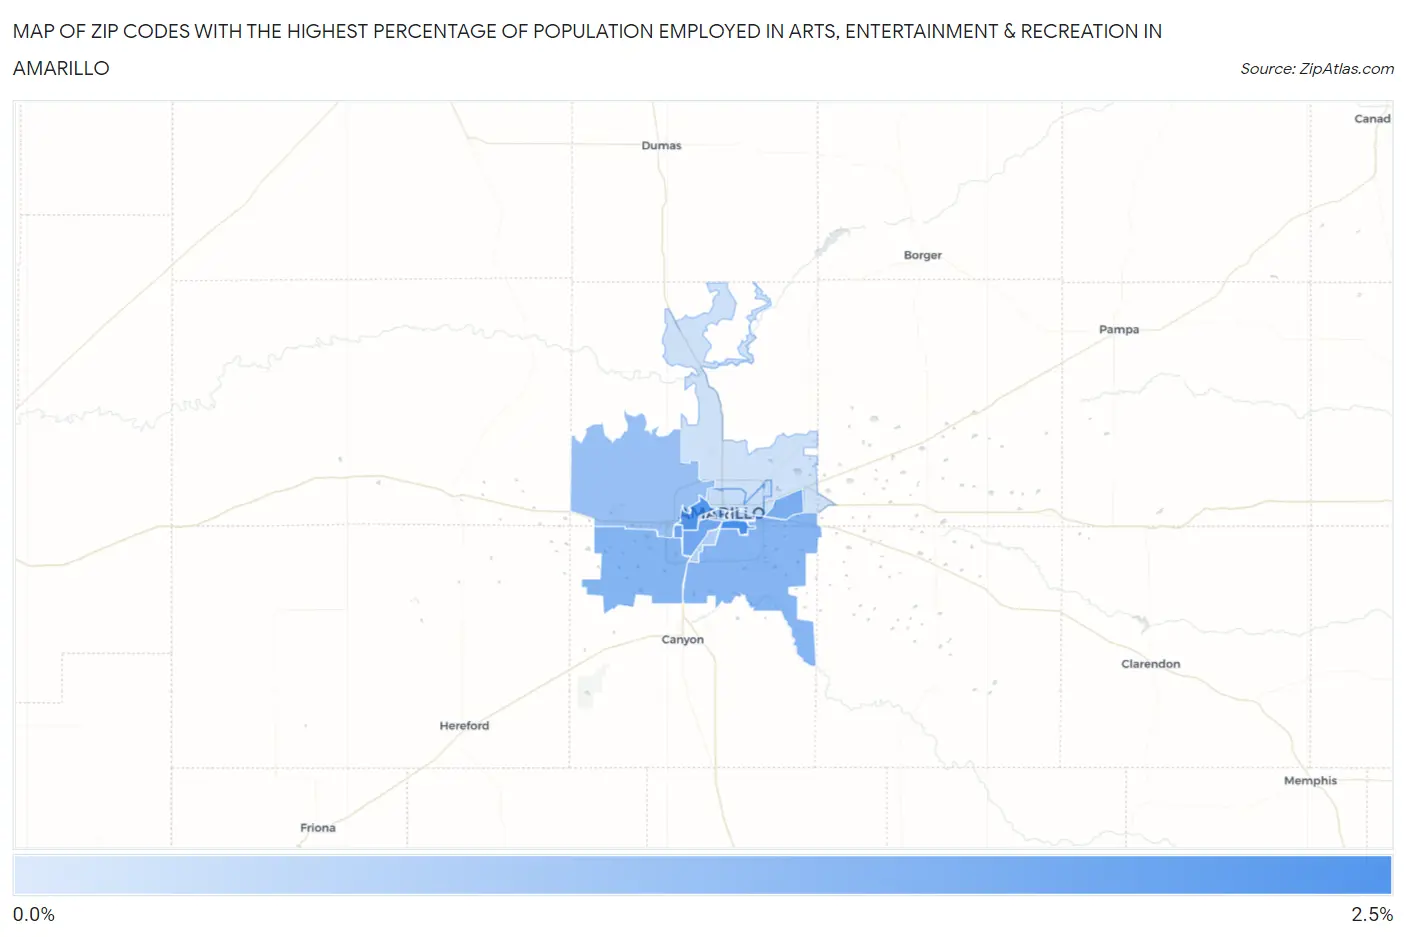
Map of Zip Codes with the Highest Percentage of Population Employed in Arts, Entertainment & Recreation in Amarillo
0.0%
2.5%
Zip Codes with the Highest Percentage of Population Employed in Arts, Entertainment & Recreation in Amarillo, TX
| Zip Code | % Employed | vs State | vs National | |
| 1. | 79103 | 2.3% | 1.5%(+0.853)#264 | 2.1%(+0.233)#8,050 |
| 2. | 79106 | 2.2% | 1.5%(+0.693)#307 | 2.1%(+0.073)#8,892 |
| 3. | 79121 | 1.7% | 1.5%(+0.259)#459 | 2.1%(-0.362)#11,578 |
| 4. | 79109 | 1.7% | 1.5%(+0.219)#473 | 2.1%(-0.401)#11,871 |
| 5. | 79111 | 1.5% | 1.5%(+0.076)#538 | 2.1%(-0.544)#12,964 |
| 6. | 79119 | 1.4% | 1.5%(-0.059)#607 | 2.1%(-0.679)#13,952 |
| 7. | 79118 | 1.4% | 1.5%(-0.112)#634 | 2.1%(-0.732)#14,357 |
| 8. | 79124 | 1.1% | 1.5%(-0.390)#781 | 2.1%(-1.01)#16,443 |
| 9. | 79101 | 0.98% | 1.5%(-0.481)#840 | 2.1%(-1.10)#17,110 |
| 10. | 79110 | 0.73% | 1.5%(-0.734)#951 | 2.1%(-1.35)#18,931 |
| 11. | 79104 | 0.53% | 1.5%(-0.936)#1,067 | 2.1%(-1.56)#20,334 |
| 12. | 79107 | 0.41% | 1.5%(-1.05)#1,115 | 2.1%(-1.67)#21,044 |
| 13. | 79108 | 0.27% | 1.5%(-1.19)#1,185 | 2.1%(-1.81)#21,869 |
| 14. | 79102 | 0.050% | 1.5%(-1.41)#1,257 | 2.1%(-2.03)#22,622 |
1
Common Questions
What are the Top 10 Zip Codes with the Highest Percentage of Population Employed in Arts, Entertainment & Recreation in Amarillo, TX?
Top 10 Zip Codes with the Highest Percentage of Population Employed in Arts, Entertainment & Recreation in Amarillo, TX are:
What zip code has the Highest Percentage of Population Employed in Arts, Entertainment & Recreation in Amarillo, TX?
79103 has the Highest Percentage of Population Employed in Arts, Entertainment & Recreation in Amarillo, TX with 2.3%.
What is the Percentage of Population Employed in Arts, Entertainment & Recreation in Amarillo, TX?
Percentage of Population Employed in Arts, Entertainment & Recreation in Amarillo is 1.3%.
What is the Percentage of Population Employed in Arts, Entertainment & Recreation in Texas?
Percentage of Population Employed in Arts, Entertainment & Recreation in Texas is 1.5%.
What is the Percentage of Population Employed in Arts, Entertainment & Recreation in the United States?
Percentage of Population Employed in Arts, Entertainment & Recreation in the United States is 2.1%.