Zip Codes with the Highest Percentage of Population Employed in Transportation & Warehousing in Tennessee
RELATED REPORTS & OPTIONS
Transportation & Warehousing
Tennessee
Compare Zip Codes
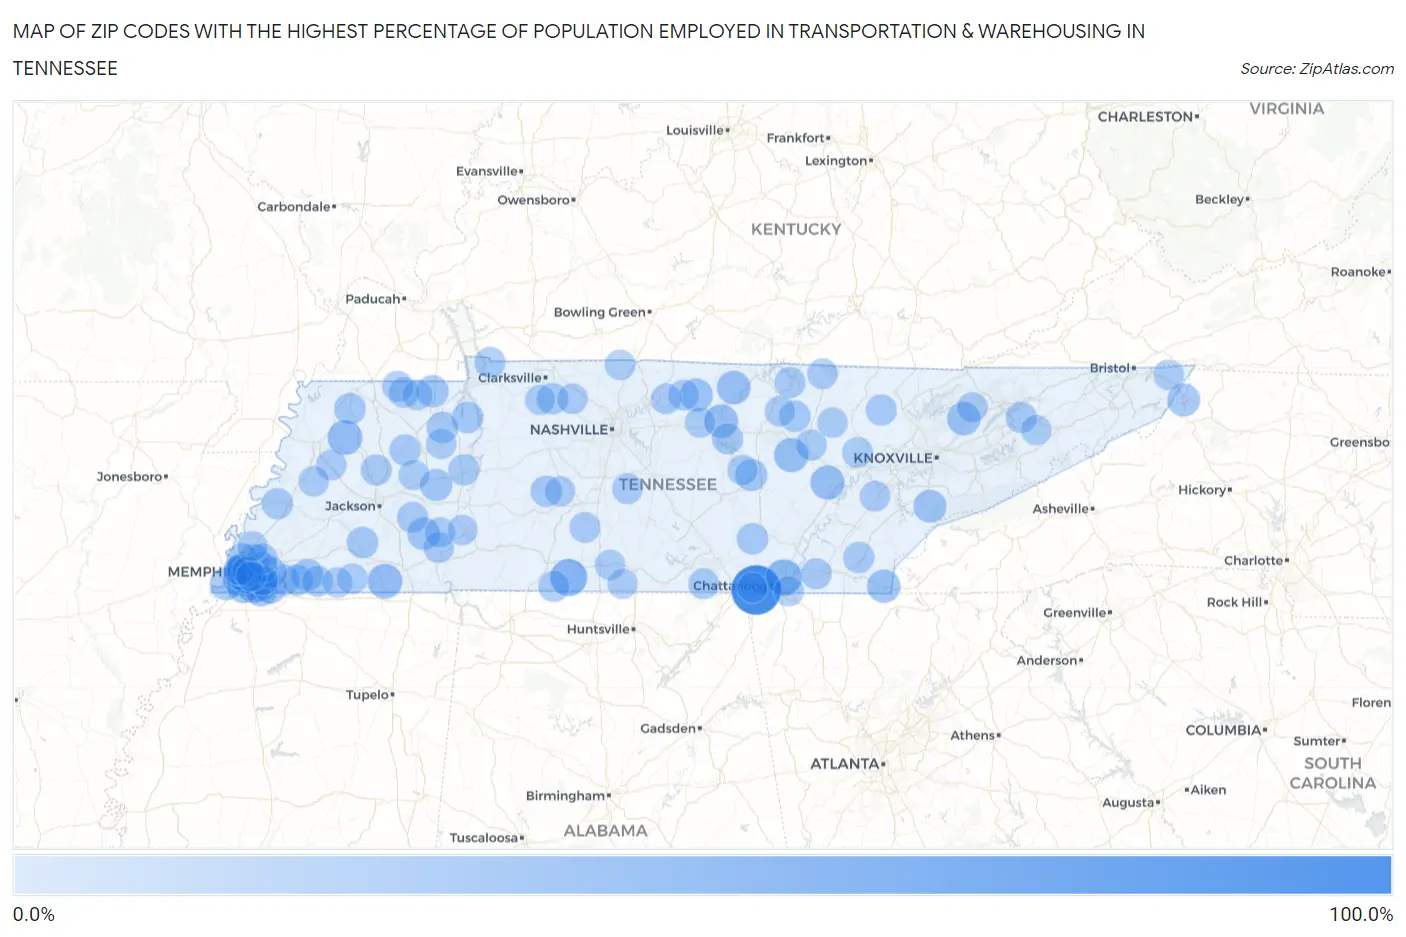
Map of Zip Codes with the Highest Percentage of Population Employed in Transportation & Warehousing in Tennessee
0.0%
100.0%
Zip Codes with the Highest Percentage of Population Employed in Transportation & Warehousing in Tennessee
| Zip Code | % Employed | vs State | vs National | |
| 1. | 37396 | 100.0% | 6.1%(+93.9)#1 | 4.9%(+95.1)#2 |
| 2. | 38460 | 39.7% | 6.1%(+33.6)#2 | 4.9%(+34.7)#129 |
| 3. | 37351 | 37.4% | 6.1%(+31.3)#3 | 4.9%(+32.4)#152 |
| 4. | 38061 | 29.9% | 6.1%(+23.8)#4 | 4.9%(+25.0)#229 |
| 5. | 38389 | 29.4% | 6.1%(+23.3)#5 | 4.9%(+24.5)#241 |
| 6. | 38578 | 27.3% | 6.1%(+21.2)#6 | 4.9%(+22.3)#284 |
| 7. | 37337 | 26.4% | 6.1%(+20.3)#7 | 4.9%(+21.5)#299 |
| 8. | 38106 | 26.3% | 6.1%(+20.2)#8 | 4.9%(+21.3)#305 |
| 9. | 38115 | 26.0% | 6.1%(+19.9)#9 | 4.9%(+21.1)#309 |
| 10. | 38552 | 25.3% | 6.1%(+19.2)#10 | 4.9%(+20.3)#327 |
| 11. | 38588 | 24.5% | 6.1%(+18.4)#11 | 4.9%(+19.6)#345 |
| 12. | 38118 | 24.1% | 6.1%(+18.0)#12 | 4.9%(+19.2)#358 |
| 13. | 38116 | 23.7% | 6.1%(+17.6)#13 | 4.9%(+18.7)#375 |
| 14. | 37326 | 23.1% | 6.1%(+17.0)#14 | 4.9%(+18.2)#390 |
| 15. | 37848 | 22.9% | 6.1%(+16.7)#15 | 4.9%(+17.9)#401 |
| 16. | 37057 | 21.4% | 6.1%(+15.3)#16 | 4.9%(+16.5)#456 |
| 17. | 37691 | 20.9% | 6.1%(+14.8)#17 | 4.9%(+15.9)#482 |
| 18. | 38141 | 20.6% | 6.1%(+14.5)#18 | 4.9%(+15.6)#504 |
| 19. | 37878 | 20.4% | 6.1%(+14.3)#19 | 4.9%(+15.4)#517 |
| 20. | 38109 | 20.3% | 6.1%(+14.1)#20 | 4.9%(+15.3)#527 |
| 21. | 38332 | 19.6% | 6.1%(+13.5)#21 | 4.9%(+14.7)#564 |
| 22. | 38125 | 18.9% | 6.1%(+12.8)#22 | 4.9%(+14.0)#596 |
| 23. | 38251 | 17.9% | 6.1%(+11.8)#23 | 4.9%(+13.0)#688 |
| 24. | 38388 | 17.5% | 6.1%(+11.4)#24 | 4.9%(+12.5)#722 |
| 25. | 38126 | 17.3% | 6.1%(+11.2)#25 | 4.9%(+12.4)#737 |
| 26. | 38114 | 17.2% | 6.1%(+11.1)#26 | 4.9%(+12.2)#755 |
| 27. | 38579 | 16.9% | 6.1%(+10.8)#27 | 4.9%(+12.0)#777 |
| 28. | 38076 | 16.5% | 6.1%(+10.4)#28 | 4.9%(+11.5)#853 |
| 29. | 38128 | 16.0% | 6.1%(+9.91)#29 | 4.9%(+11.1)#906 |
| 30. | 38253 | 15.0% | 6.1%(+8.91)#30 | 4.9%(+10.1)#1,061 |
| 31. | 38221 | 14.7% | 6.1%(+8.57)#31 | 4.9%(+9.74)#1,126 |
| 32. | 38236 | 14.6% | 6.1%(+8.50)#32 | 4.9%(+9.66)#1,141 |
| 33. | 37365 | 14.5% | 6.1%(+8.38)#33 | 4.9%(+9.54)#1,169 |
| 34. | 38381 | 14.4% | 6.1%(+8.24)#34 | 4.9%(+9.40)#1,193 |
| 35. | 37171 | 14.3% | 6.1%(+8.15)#35 | 4.9%(+9.32)#1,225 |
| 36. | 38454 | 14.3% | 6.1%(+8.14)#36 | 4.9%(+9.31)#1,228 |
| 37. | 38017 | 14.1% | 6.1%(+8.03)#37 | 4.9%(+9.19)#1,252 |
| 38. | 38554 | 13.9% | 6.1%(+7.75)#38 | 4.9%(+8.92)#1,309 |
| 39. | 38066 | 13.6% | 6.1%(+7.53)#39 | 4.9%(+8.69)#1,363 |
| 40. | 38127 | 13.5% | 6.1%(+7.37)#40 | 4.9%(+8.53)#1,393 |
| 41. | 38041 | 13.4% | 6.1%(+7.34)#41 | 4.9%(+8.50)#1,405 |
| 42. | 37325 | 13.3% | 6.1%(+7.16)#42 | 4.9%(+8.33)#1,458 |
| 43. | 38018 | 13.0% | 6.1%(+6.90)#43 | 4.9%(+8.07)#1,531 |
| 44. | 38352 | 12.9% | 6.1%(+6.83)#44 | 4.9%(+7.99)#1,548 |
| 45. | 38258 | 12.9% | 6.1%(+6.78)#45 | 4.9%(+7.94)#1,568 |
| 46. | 38573 | 12.9% | 6.1%(+6.75)#46 | 4.9%(+7.91)#1,573 |
| 47. | 38107 | 12.8% | 6.1%(+6.67)#47 | 4.9%(+7.83)#1,600 |
| 48. | 38457 | 12.8% | 6.1%(+6.66)#48 | 4.9%(+7.83)#1,602 |
| 49. | 38582 | 12.7% | 6.1%(+6.55)#49 | 4.9%(+7.71)#1,633 |
| 50. | 38105 | 12.6% | 6.1%(+6.47)#50 | 4.9%(+7.64)#1,656 |
| 51. | 38341 | 12.6% | 6.1%(+6.46)#51 | 4.9%(+7.63)#1,658 |
| 52. | 38338 | 12.5% | 6.1%(+6.39)#52 | 4.9%(+7.55)#1,686 |
| 53. | 37860 | 12.3% | 6.1%(+6.22)#53 | 4.9%(+7.38)#1,739 |
| 54. | 38057 | 12.3% | 6.1%(+6.21)#54 | 4.9%(+7.38)#1,742 |
| 55. | 37028 | 12.1% | 6.1%(+5.95)#55 | 4.9%(+7.11)#1,833 |
| 56. | 38571 | 12.0% | 6.1%(+5.89)#56 | 4.9%(+7.06)#1,851 |
| 57. | 37756 | 12.0% | 6.1%(+5.88)#57 | 4.9%(+7.04)#1,866 |
| 58. | 37376 | 11.9% | 6.1%(+5.83)#58 | 4.9%(+6.99)#1,894 |
| 59. | 37353 | 11.8% | 6.1%(+5.67)#59 | 4.9%(+6.83)#1,959 |
| 60. | 38134 | 11.8% | 6.1%(+5.65)#60 | 4.9%(+6.81)#1,976 |
| 61. | 38451 | 11.5% | 6.1%(+5.42)#61 | 4.9%(+6.58)#2,066 |
| 62. | 37060 | 11.3% | 6.1%(+5.21)#62 | 4.9%(+6.38)#2,164 |
| 63. | 38226 | 11.3% | 6.1%(+5.21)#63 | 4.9%(+6.37)#2,167 |
| 64. | 37829 | 11.3% | 6.1%(+5.20)#64 | 4.9%(+6.36)#2,174 |
| 65. | 37074 | 11.1% | 6.1%(+4.97)#65 | 4.9%(+6.13)#2,289 |
| 66. | 38577 | 10.9% | 6.1%(+4.80)#66 | 4.9%(+5.96)#2,366 |
| 67. | 38119 | 10.8% | 6.1%(+4.73)#67 | 4.9%(+5.89)#2,402 |
| 68. | 38241 | 10.8% | 6.1%(+4.70)#68 | 4.9%(+5.86)#2,413 |
| 69. | 38361 | 10.8% | 6.1%(+4.68)#69 | 4.9%(+5.84)#2,429 |
| 70. | 37031 | 10.7% | 6.1%(+4.61)#70 | 4.9%(+5.78)#2,462 |
| 71. | 37035 | 10.6% | 6.1%(+4.47)#71 | 4.9%(+5.63)#2,539 |
| 72. | 37726 | 10.2% | 6.1%(+4.07)#72 | 4.9%(+5.24)#2,771 |
| 73. | 37888 | 10.2% | 6.1%(+4.07)#73 | 4.9%(+5.23)#2,773 |
| 74. | 38103 | 10.1% | 6.1%(+4.01)#74 | 4.9%(+5.18)#2,805 |
| 75. | 38067 | 10.1% | 6.1%(+3.99)#75 | 4.9%(+5.16)#2,823 |
| 76. | 38034 | 10.1% | 6.1%(+3.97)#76 | 4.9%(+5.13)#2,840 |
| 77. | 37846 | 10.0% | 6.1%(+3.93)#77 | 4.9%(+5.10)#2,852 |
| 78. | 38037 | 10.0% | 6.1%(+3.85)#78 | 4.9%(+5.02)#2,920 |
| 79. | 38135 | 10.0% | 6.1%(+3.84)#79 | 4.9%(+5.01)#2,927 |
| 80. | 38317 | 9.9% | 6.1%(+3.81)#80 | 4.9%(+4.97)#2,942 |
| 81. | 38587 | 9.9% | 6.1%(+3.76)#81 | 4.9%(+4.93)#2,969 |
| 82. | 38371 | 9.8% | 6.1%(+3.74)#82 | 4.9%(+4.90)#2,984 |
| 83. | 38039 | 9.8% | 6.1%(+3.72)#83 | 4.9%(+4.88)#3,000 |
| 84. | 38487 | 9.8% | 6.1%(+3.65)#84 | 4.9%(+4.81)#3,037 |
| 85. | 37141 | 9.8% | 6.1%(+3.64)#85 | 4.9%(+4.81)#3,043 |
| 86. | 38321 | 9.7% | 6.1%(+3.64)#86 | 4.9%(+4.80)#3,044 |
| 87. | 37688 | 9.6% | 6.1%(+3.50)#87 | 4.9%(+4.67)#3,150 |
| 88. | 38459 | 9.6% | 6.1%(+3.48)#88 | 4.9%(+4.64)#3,175 |
| 89. | 37340 | 9.5% | 6.1%(+3.35)#89 | 4.9%(+4.51)#3,267 |
| 90. | 38563 | 9.4% | 6.1%(+3.33)#90 | 4.9%(+4.49)#3,279 |
| 91. | 37809 | 9.4% | 6.1%(+3.29)#91 | 4.9%(+4.45)#3,319 |
| 92. | 38112 | 9.4% | 6.1%(+3.27)#92 | 4.9%(+4.44)#3,328 |
| 93. | 38580 | 9.2% | 6.1%(+3.11)#93 | 4.9%(+4.28)#3,462 |
| 94. | 38488 | 9.2% | 6.1%(+3.08)#94 | 4.9%(+4.24)#3,496 |
| 95. | 37412 | 9.1% | 6.1%(+2.99)#95 | 4.9%(+4.16)#3,587 |
| 96. | 38311 | 9.1% | 6.1%(+2.98)#96 | 4.9%(+4.14)#3,603 |
| 97. | 37052 | 9.1% | 6.1%(+2.95)#97 | 4.9%(+4.12)#3,634 |
| 98. | 38111 | 9.1% | 6.1%(+2.94)#98 | 4.9%(+4.11)#3,647 |
| 99. | 38053 | 9.0% | 6.1%(+2.94)#99 | 4.9%(+4.10)#3,652 |
| 100. | 38224 | 9.0% | 6.1%(+2.89)#100 | 4.9%(+4.06)#3,702 |
Common Questions
What are the Top 10 Zip Codes with the Highest Percentage of Population Employed in Transportation & Warehousing in Tennessee?
Top 10 Zip Codes with the Highest Percentage of Population Employed in Transportation & Warehousing in Tennessee are:
What zip code has the Highest Percentage of Population Employed in Transportation & Warehousing in Tennessee?
37396 has the Highest Percentage of Population Employed in Transportation & Warehousing in Tennessee with 100.0%.
What is the Percentage of Population Employed in Transportation & Warehousing in the State of Tennessee?
Percentage of Population Employed in Transportation & Warehousing in Tennessee is 6.1%.
What is the Percentage of Population Employed in Transportation & Warehousing in the United States?
Percentage of Population Employed in Transportation & Warehousing in the United States is 4.9%.