Zip Codes with the Highest Percentage of Population Employed in Sales & Related in Morristown, TN
RELATED REPORTS & OPTIONS
Sales & Related
Morristown
Compare Zip Codes
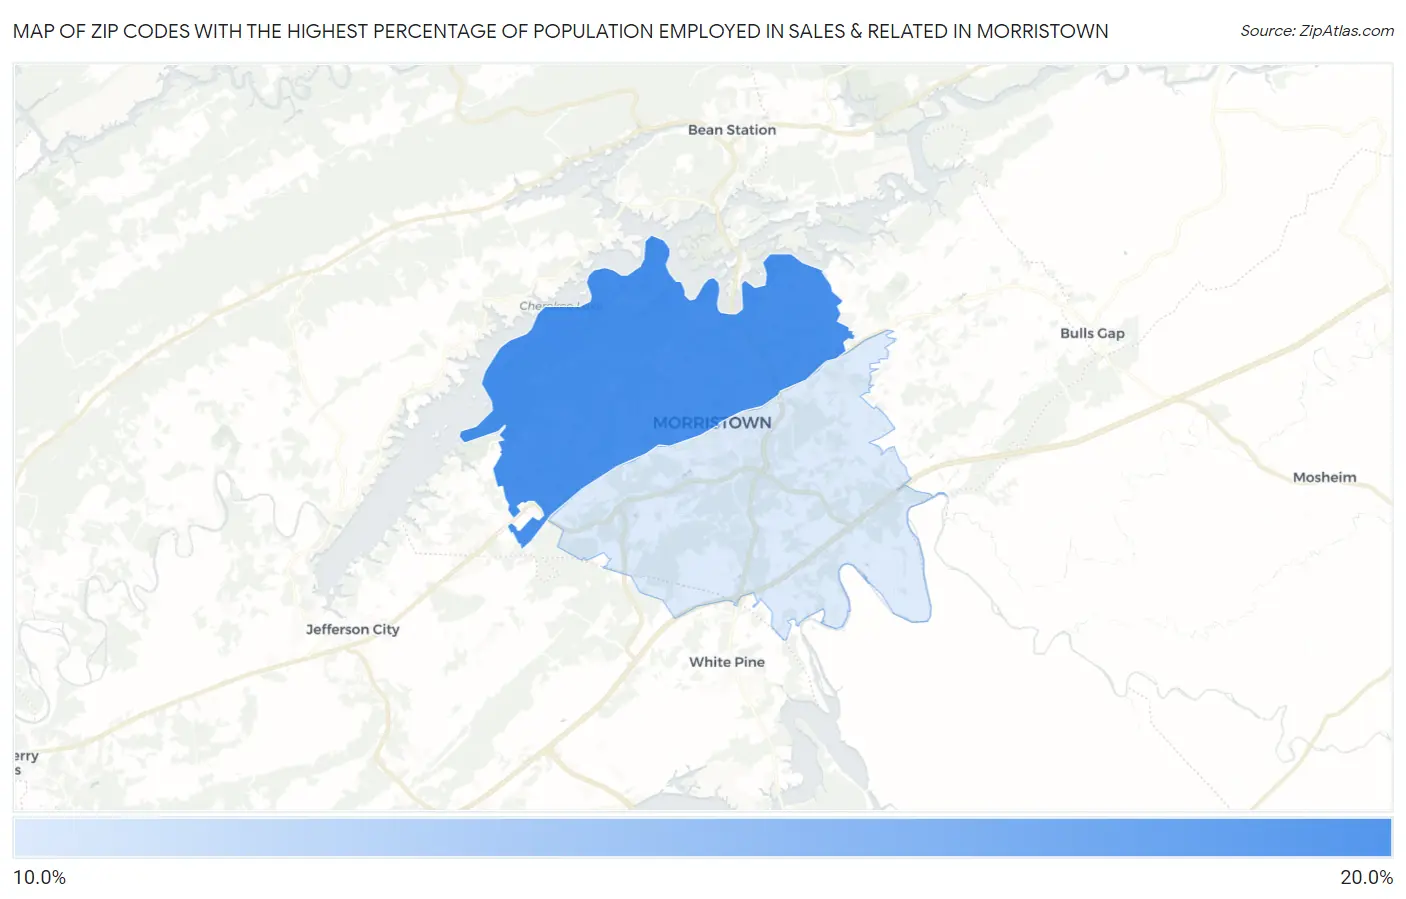
Map of Zip Codes with the Highest Percentage of Population Employed in Sales & Related in Morristown
10.0%
15.1%
Zip Codes with the Highest Percentage of Population Employed in Sales & Related in Morristown, TN
| Zip Code | % Employed | vs State | vs National | |
| 1. | 37814 | 15.1% | 9.8%(+5.25)#46 | 9.6%(+5.49)#2,680 |
| 2. | 37813 | 10.0% | 9.8%(+0.185)#218 | 9.6%(+0.424)#10,946 |
1
Common Questions
What are the Top Zip Codes with the Highest Percentage of Population Employed in Sales & Related in Morristown, TN?
Top Zip Codes with the Highest Percentage of Population Employed in Sales & Related in Morristown, TN are:
What zip code has the Highest Percentage of Population Employed in Sales & Related in Morristown, TN?
37814 has the Highest Percentage of Population Employed in Sales & Related in Morristown, TN with 15.1%.
What is the Percentage of Population Employed in Sales & Related in Morristown, TN?
Percentage of Population Employed in Sales & Related in Morristown is 16.2%.
What is the Percentage of Population Employed in Sales & Related in Tennessee?
Percentage of Population Employed in Sales & Related in Tennessee is 9.8%.
What is the Percentage of Population Employed in Sales & Related in the United States?
Percentage of Population Employed in Sales & Related in the United States is 9.6%.