Zip Codes with the Highest Percentage of Population Employed in Arts, Entertainment & Recreation in Morristown, TN
RELATED REPORTS & OPTIONS
Arts, Entertainment & Recreation
Morristown
Compare Zip Codes
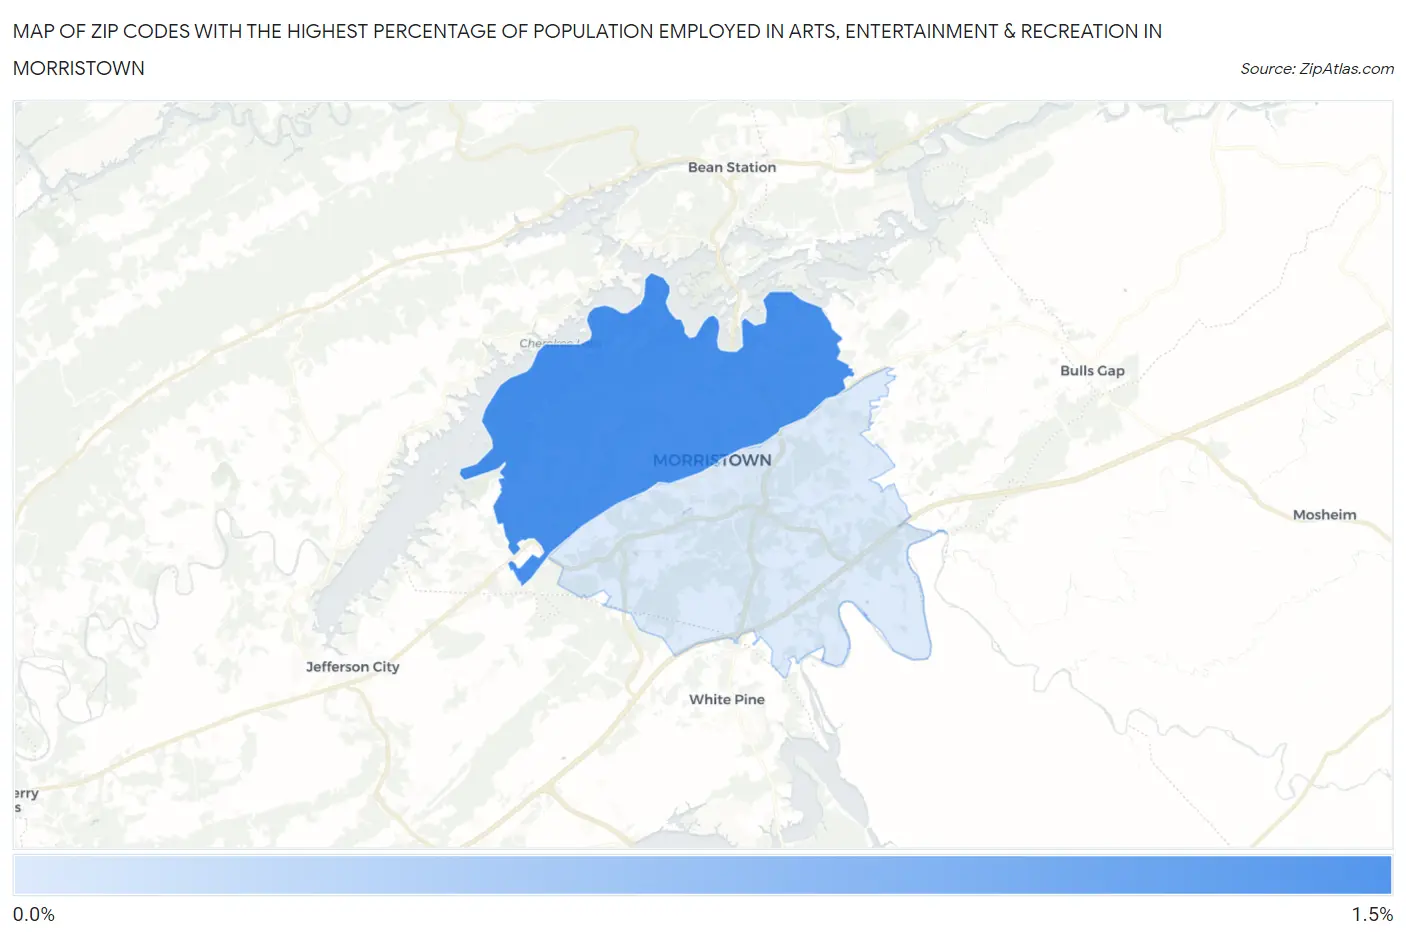
Map of Zip Codes with the Highest Percentage of Population Employed in Arts, Entertainment & Recreation in Morristown
0.0%
1.5%
Zip Codes with the Highest Percentage of Population Employed in Arts, Entertainment & Recreation in Morristown, TN
| Zip Code | % Employed | vs State | vs National | |
| 1. | 37814 | 1.4% | 1.8%(-0.417)#209 | 2.1%(-0.713)#14,220 |
| 2. | 37813 | 0.34% | 1.8%(-1.44)#400 | 2.1%(-1.74)#21,456 |
1
Common Questions
What are the Top Zip Codes with the Highest Percentage of Population Employed in Arts, Entertainment & Recreation in Morristown, TN?
Top Zip Codes with the Highest Percentage of Population Employed in Arts, Entertainment & Recreation in Morristown, TN are:
What zip code has the Highest Percentage of Population Employed in Arts, Entertainment & Recreation in Morristown, TN?
37814 has the Highest Percentage of Population Employed in Arts, Entertainment & Recreation in Morristown, TN with 1.4%.
What is the Percentage of Population Employed in Arts, Entertainment & Recreation in Morristown, TN?
Percentage of Population Employed in Arts, Entertainment & Recreation in Morristown is 1.1%.
What is the Percentage of Population Employed in Arts, Entertainment & Recreation in Tennessee?
Percentage of Population Employed in Arts, Entertainment & Recreation in Tennessee is 1.8%.
What is the Percentage of Population Employed in Arts, Entertainment & Recreation in the United States?
Percentage of Population Employed in Arts, Entertainment & Recreation in the United States is 2.1%.