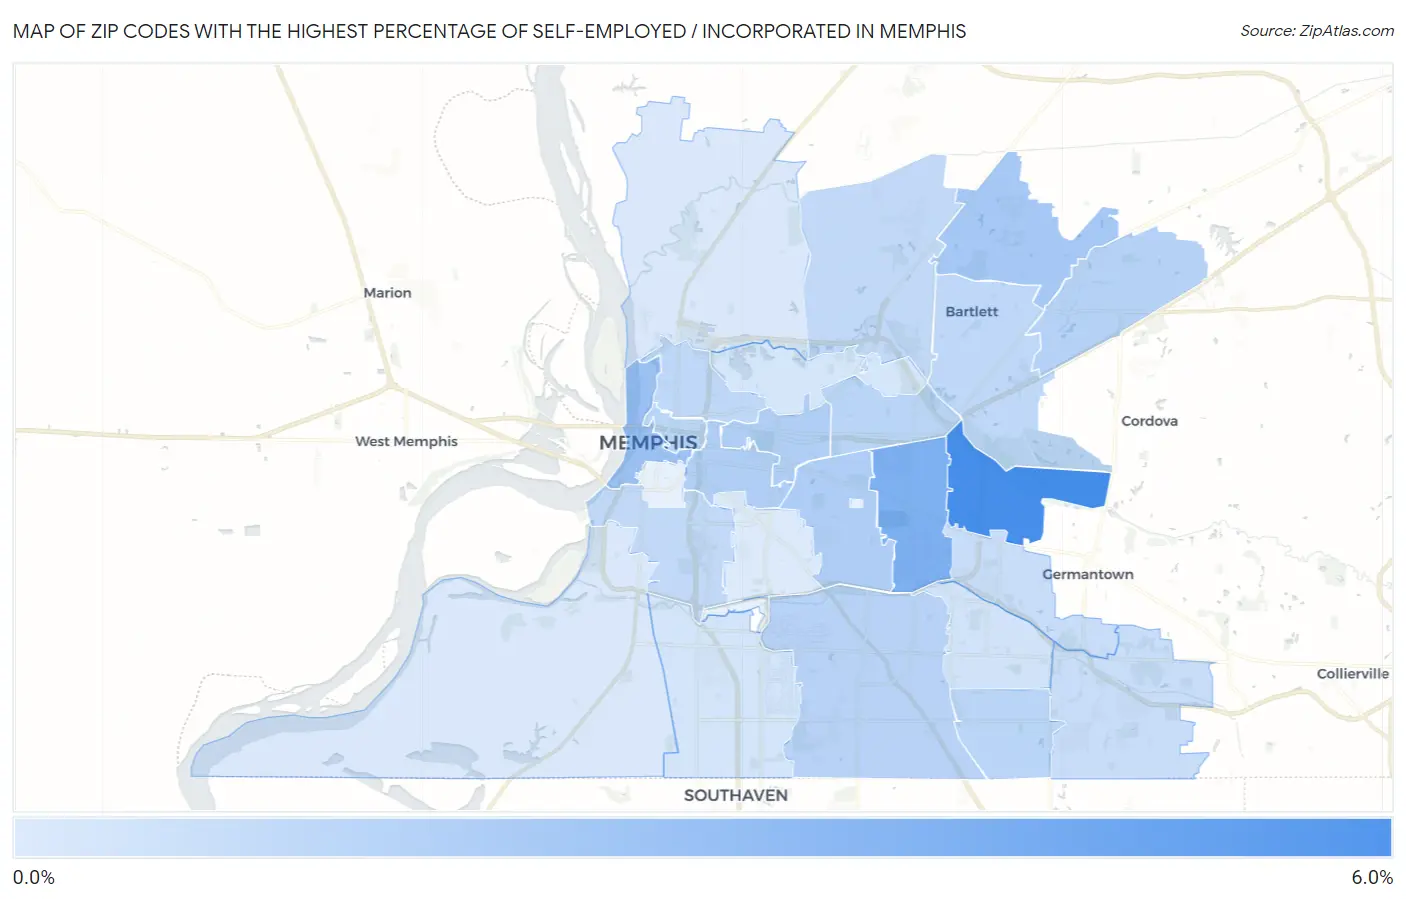
Zip Codes with the Highest Percentage of Self-Employed / Incorporated in Memphis, TN
RELATED REPORTS & OPTIONS
Self-Employed / Incorporated
Memphis
Compare Zip Codes
Map of Zip Codes with the Highest Percentage of Self-Employed / Incorporated in Memphis
0.64%
5.5%
Zip Codes with the Highest Percentage of Self-Employed / Incorporated in Memphis, TN
| Zip Code | % Self-Employed / Incorporated | vs State | vs National | |
| 1. | 38120 | 5.5% | 2.6%(+2.86)#47 | 3.8%(+1.67)#7,384 |
| 2. | 38117 | 3.7% | 2.6%(+1.08)#117 | 3.8%(-0.115)#13,186 |
| 3. | 38103 | 2.8% | 2.6%(+0.126)#195 | 3.8%(-1.06)#17,604 |
| 4. | 38135 | 2.4% | 2.6%(-0.262)#254 | 3.8%(-1.45)#19,561 |
| 5. | 38111 | 2.1% | 2.6%(-0.541)#289 | 3.8%(-1.73)#20,946 |
| 6. | 38104 | 2.0% | 2.6%(-0.591)#297 | 3.8%(-1.78)#21,200 |
| 7. | 38112 | 2.0% | 2.6%(-0.628)#303 | 3.8%(-1.82)#21,381 |
| 8. | 38133 | 1.9% | 2.6%(-0.756)#327 | 3.8%(-1.95)#21,961 |
| 9. | 38118 | 1.8% | 2.6%(-0.782)#332 | 3.8%(-1.97)#22,083 |
| 10. | 38122 | 1.7% | 2.6%(-0.906)#354 | 3.8%(-2.10)#22,584 |
| 11. | 38105 | 1.7% | 2.6%(-0.914)#355 | 3.8%(-2.11)#22,627 |
| 12. | 38141 | 1.7% | 2.6%(-0.923)#356 | 3.8%(-2.11)#22,664 |
| 13. | 38134 | 1.6% | 2.6%(-1.02)#365 | 3.8%(-2.21)#23,076 |
| 14. | 38107 | 1.6% | 2.6%(-1.03)#366 | 3.8%(-2.22)#23,100 |
| 15. | 38128 | 1.5% | 2.6%(-1.08)#374 | 3.8%(-2.27)#23,326 |
| 16. | 38106 | 1.5% | 2.6%(-1.11)#376 | 3.8%(-2.30)#23,412 |
| 17. | 38119 | 1.3% | 2.6%(-1.32)#410 | 3.8%(-2.51)#24,225 |
| 18. | 38125 | 1.3% | 2.6%(-1.33)#412 | 3.8%(-2.52)#24,266 |
| 19. | 38115 | 0.98% | 2.6%(-1.65)#450 | 3.8%(-2.84)#25,346 |
| 20. | 38116 | 0.95% | 2.6%(-1.68)#453 | 3.8%(-2.87)#25,432 |
| 21. | 38108 | 0.85% | 2.6%(-1.78)#460 | 3.8%(-2.97)#25,695 |
| 22. | 38127 | 0.72% | 2.6%(-1.90)#473 | 3.8%(-3.10)#26,012 |
| 23. | 38109 | 0.71% | 2.6%(-1.92)#476 | 3.8%(-3.11)#26,058 |
| 24. | 38114 | 0.64% | 2.6%(-1.99)#481 | 3.8%(-3.18)#26,214 |
1
Common Questions
What are the Top 10 Zip Codes with the Highest Percentage of Self-Employed / Incorporated in Memphis, TN?
Top 10 Zip Codes with the Highest Percentage of Self-Employed / Incorporated in Memphis, TN are:
What zip code has the Highest Percentage of Self-Employed / Incorporated in Memphis, TN?
38120 has the Highest Percentage of Self-Employed / Incorporated in Memphis, TN with 5.5%.
What is the Percentage of Self-Employed / Incorporated in Memphis, TN?
Percentage of Self-Employed / Incorporated in Memphis is 1.8%.
What is the Percentage of Self-Employed / Incorporated in Tennessee?
Percentage of Self-Employed / Incorporated in Tennessee is 2.6%.
What is the Percentage of Self-Employed / Incorporated in the United States?
Percentage of Self-Employed / Incorporated in the United States is 3.8%.