Zip Codes with the Highest Percentage of Population Employed in Professional & Scientific Services in Maryville, TN
RELATED REPORTS & OPTIONS
Professional & Scientific Services
Maryville
Compare Zip Codes
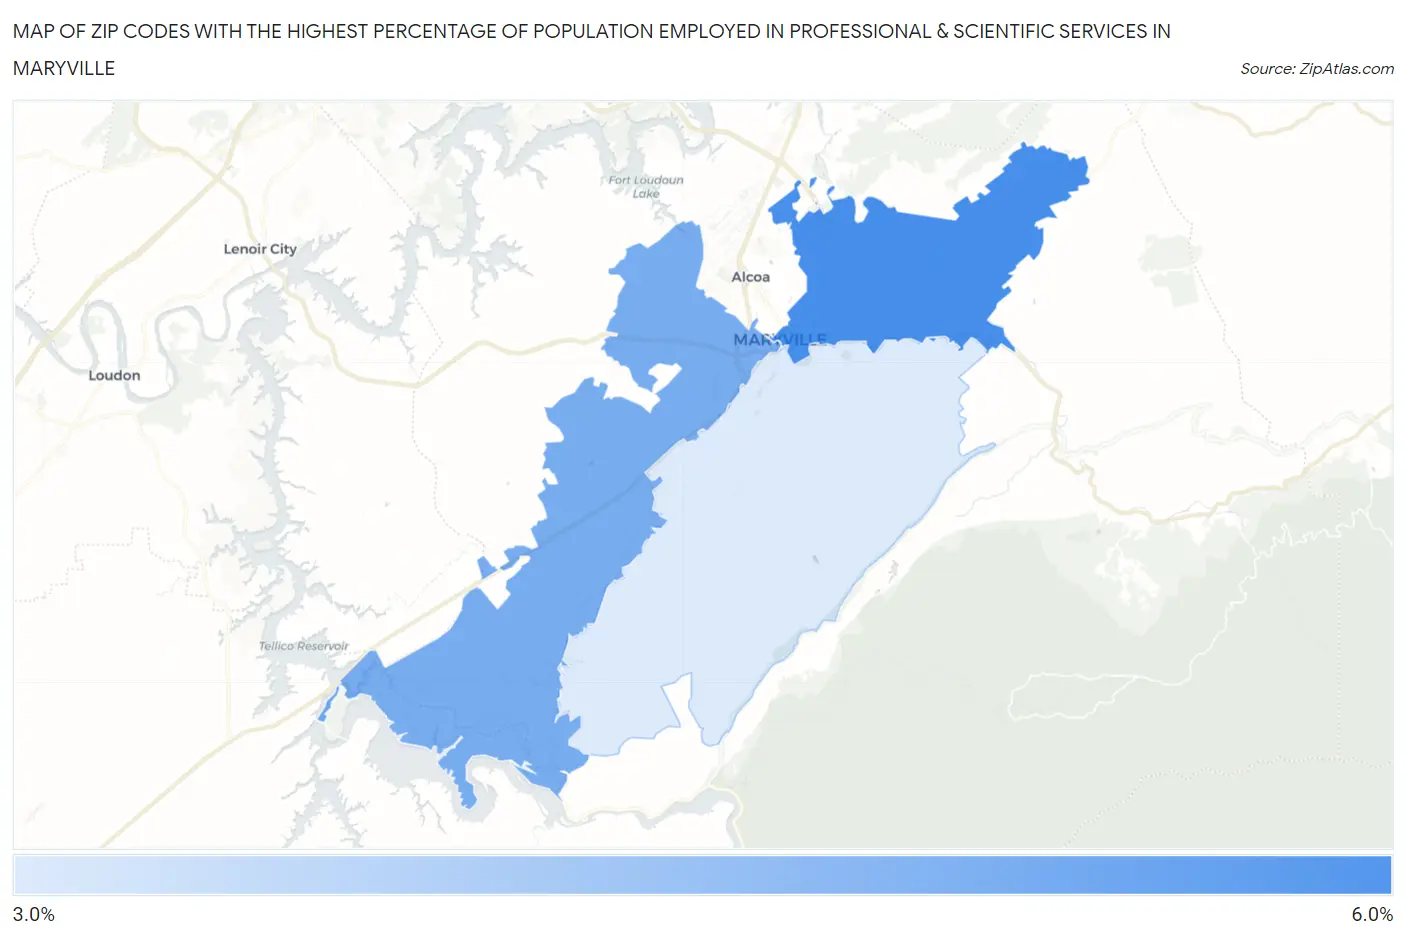
Map of Zip Codes with the Highest Percentage of Population Employed in Professional & Scientific Services in Maryville
0.0%
6.0%
Zip Codes with the Highest Percentage of Population Employed in Professional & Scientific Services in Maryville, TN
| Zip Code | % Employed | vs State | vs National | |
| 1. | 37804 | 5.2% | 5.7%(-0.499)#177 | 7.8%(-2.62)#11,748 |
| 2. | 37801 | 4.7% | 5.7%(-1.04)#200 | 7.8%(-3.16)#13,137 |
| 3. | 37803 | 3.6% | 5.7%(-2.15)#267 | 7.8%(-4.27)#16,471 |
1
Common Questions
What are the Top Zip Codes with the Highest Percentage of Population Employed in Professional & Scientific Services in Maryville, TN?
Top Zip Codes with the Highest Percentage of Population Employed in Professional & Scientific Services in Maryville, TN are:
What zip code has the Highest Percentage of Population Employed in Professional & Scientific Services in Maryville, TN?
37804 has the Highest Percentage of Population Employed in Professional & Scientific Services in Maryville, TN with 5.2%.
What is the Percentage of Population Employed in Professional & Scientific Services in Maryville, TN?
Percentage of Population Employed in Professional & Scientific Services in Maryville is 6.2%.
What is the Percentage of Population Employed in Professional & Scientific Services in Tennessee?
Percentage of Population Employed in Professional & Scientific Services in Tennessee is 5.7%.
What is the Percentage of Population Employed in Professional & Scientific Services in the United States?
Percentage of Population Employed in Professional & Scientific Services in the United States is 7.8%.