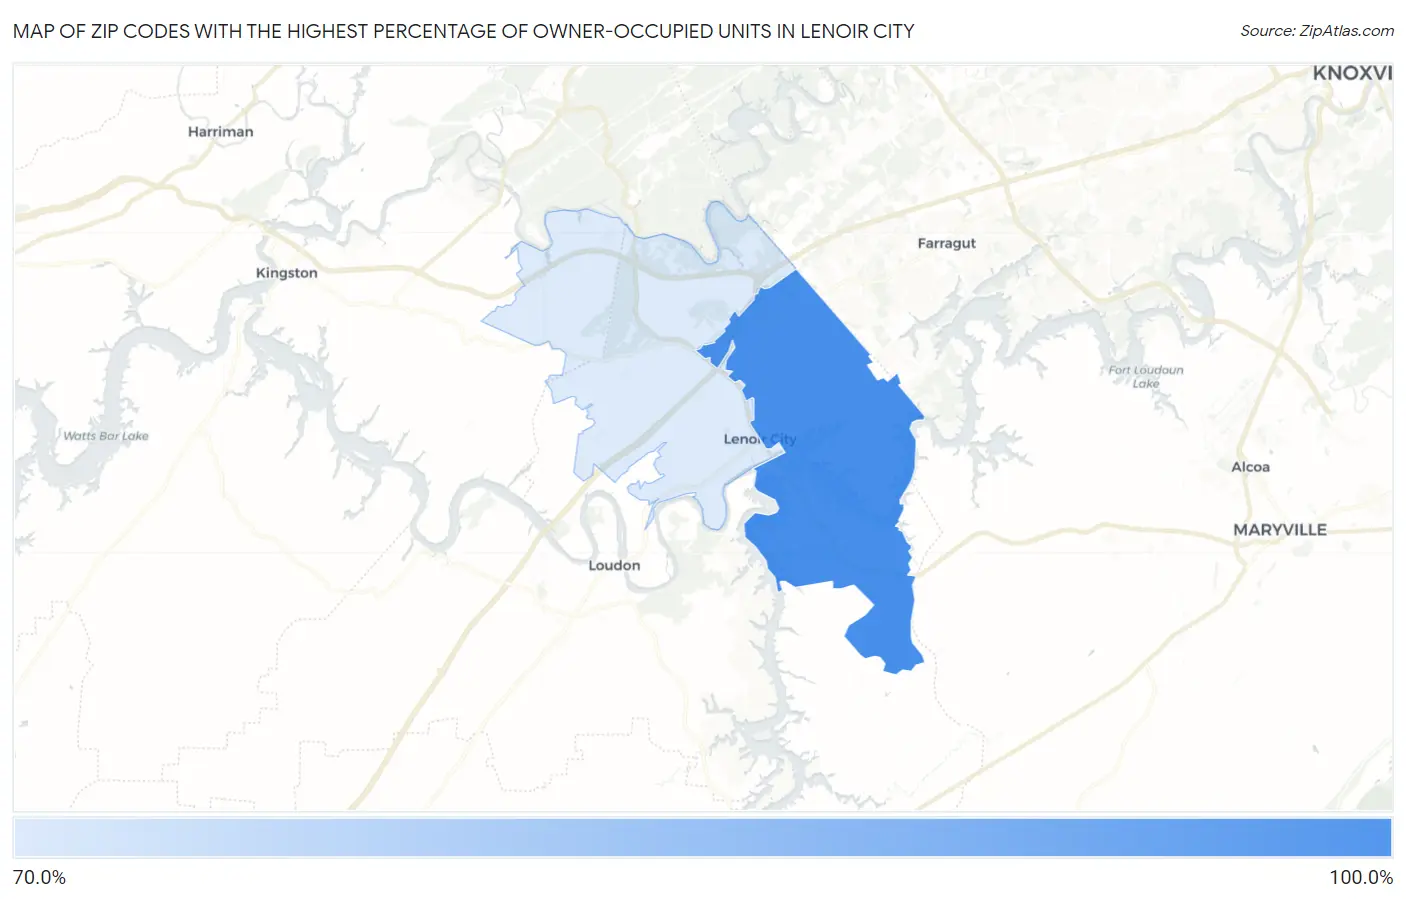
Zip Codes with the Highest Percentage of Owner-Occupied Units in Lenoir City, TN
RELATED REPORTS & OPTIONS
Highest Owner-Occupied
Lenoir City
Compare Zip Codes
Map of Zip Codes with the Highest Percentage of Owner-Occupied Units in Lenoir City
0.0%
100.0%
Zip Codes with the Highest Percentage of Owner-Occupied Units in Lenoir City, TN
| Zip Code | % Owner-Occupied | vs State | vs National | |
| 1. | 37772 | 84.3% | 67.1%(+17.3)#154 | 64.8%(+19.5)#10,347 |
| 2. | 37771 | 70.1% | 67.1%(+3.04)#441 | 64.8%(+5.28)#22,680 |
1
Common Questions
What are the Top Zip Codes with the Highest Percentage of Owner-Occupied Units in Lenoir City, TN?
Top Zip Codes with the Highest Percentage of Owner-Occupied Units in Lenoir City, TN are:
What zip code has the Highest Percentage of Owner-Occupied Units in Lenoir City, TN?
37772 has the Highest Percentage of Owner-Occupied Units in Lenoir City, TN with 84.3%.
What is the Percentage of Owner-Occupied Units in Lenoir City, TN?
Percentage of Owner-Occupied Units in Lenoir City is 61.3%.
What is the Percentage of Owner-Occupied Units in Tennessee?
Percentage of Owner-Occupied Units in Tennessee is 67.1%.
What is the Percentage of Owner-Occupied Units in the United States?
Percentage of Owner-Occupied Units in the United States is 64.8%.