Zip Codes with the Highest Percentage of Population Employed in Manufacturing in Kingsport, TN
RELATED REPORTS & OPTIONS
Manufacturing
Kingsport
Compare Zip Codes
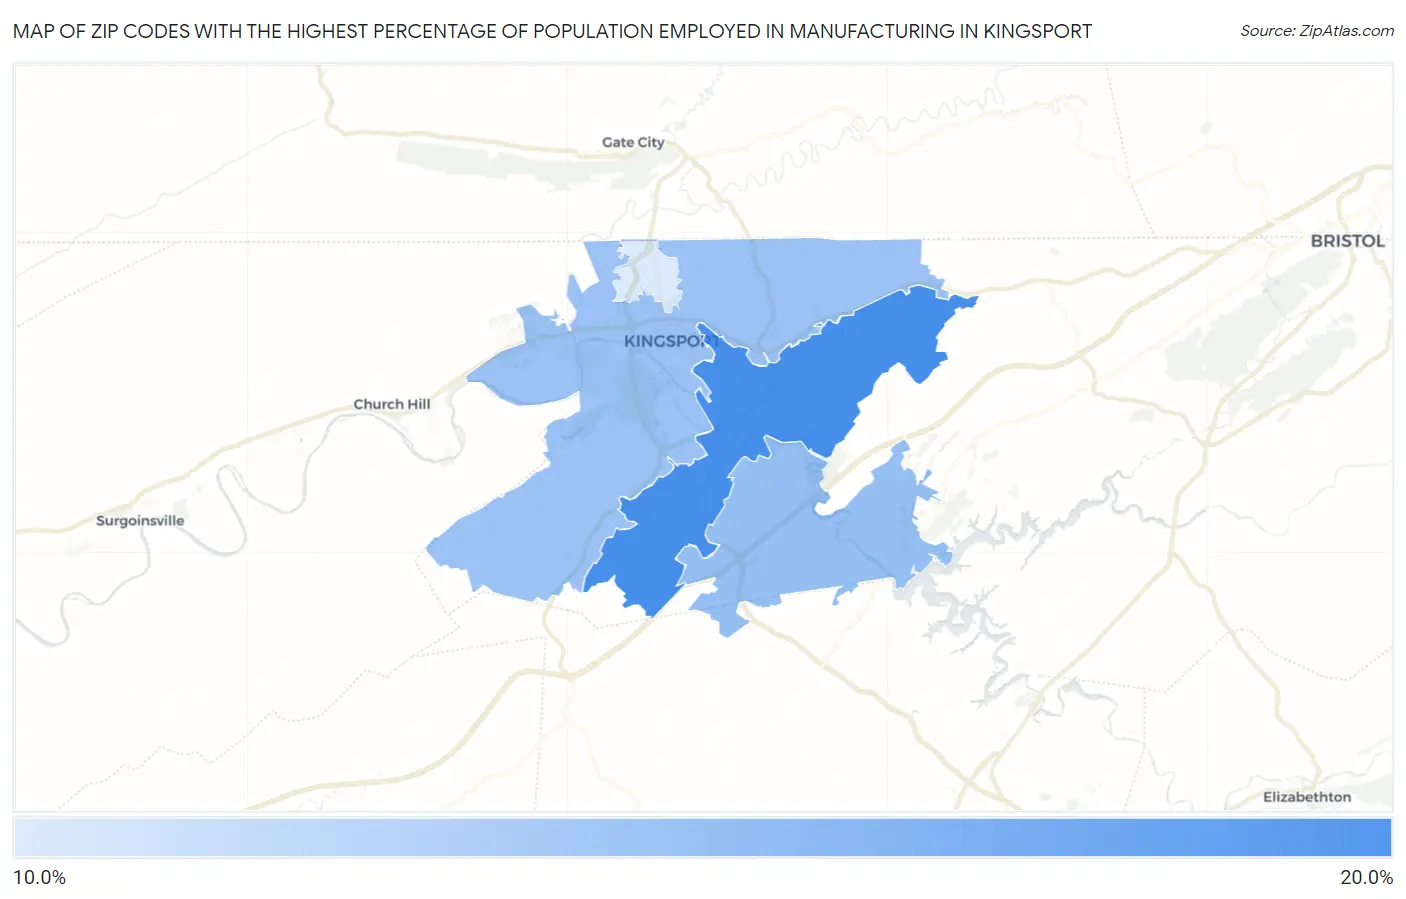
Map of Zip Codes with the Highest Percentage of Population Employed in Manufacturing in Kingsport
0.0%
20.0%
Zip Codes with the Highest Percentage of Population Employed in Manufacturing in Kingsport, TN
| Zip Code | % Employed | vs State | vs National | |
| 1. | 37664 | 17.6% | 12.9%(+4.68)#251 | 10.0%(+7.63)#6,620 |
| 2. | 37663 | 15.5% | 12.9%(+2.62)#313 | 10.0%(+5.56)#8,483 |
| 3. | 37660 | 15.4% | 12.9%(+2.47)#318 | 10.0%(+5.42)#8,627 |
| 4. | 37665 | 13.7% | 12.9%(+0.769)#360 | 10.0%(+3.71)#10,517 |
1
Common Questions
What are the Top 3 Zip Codes with the Highest Percentage of Population Employed in Manufacturing in Kingsport, TN?
Top 3 Zip Codes with the Highest Percentage of Population Employed in Manufacturing in Kingsport, TN are:
What zip code has the Highest Percentage of Population Employed in Manufacturing in Kingsport, TN?
37664 has the Highest Percentage of Population Employed in Manufacturing in Kingsport, TN with 17.6%.
What is the Percentage of Population Employed in Manufacturing in Kingsport, TN?
Percentage of Population Employed in Manufacturing in Kingsport is 16.3%.
What is the Percentage of Population Employed in Manufacturing in Tennessee?
Percentage of Population Employed in Manufacturing in Tennessee is 12.9%.
What is the Percentage of Population Employed in Manufacturing in the United States?
Percentage of Population Employed in Manufacturing in the United States is 10.0%.