Zip Codes with the Highest Percentage of Population Employed in Farming, Fishing & Forestry in Kingsport, TN
RELATED REPORTS & OPTIONS
Farming, Fishing & Forestry
Kingsport
Compare Zip Codes
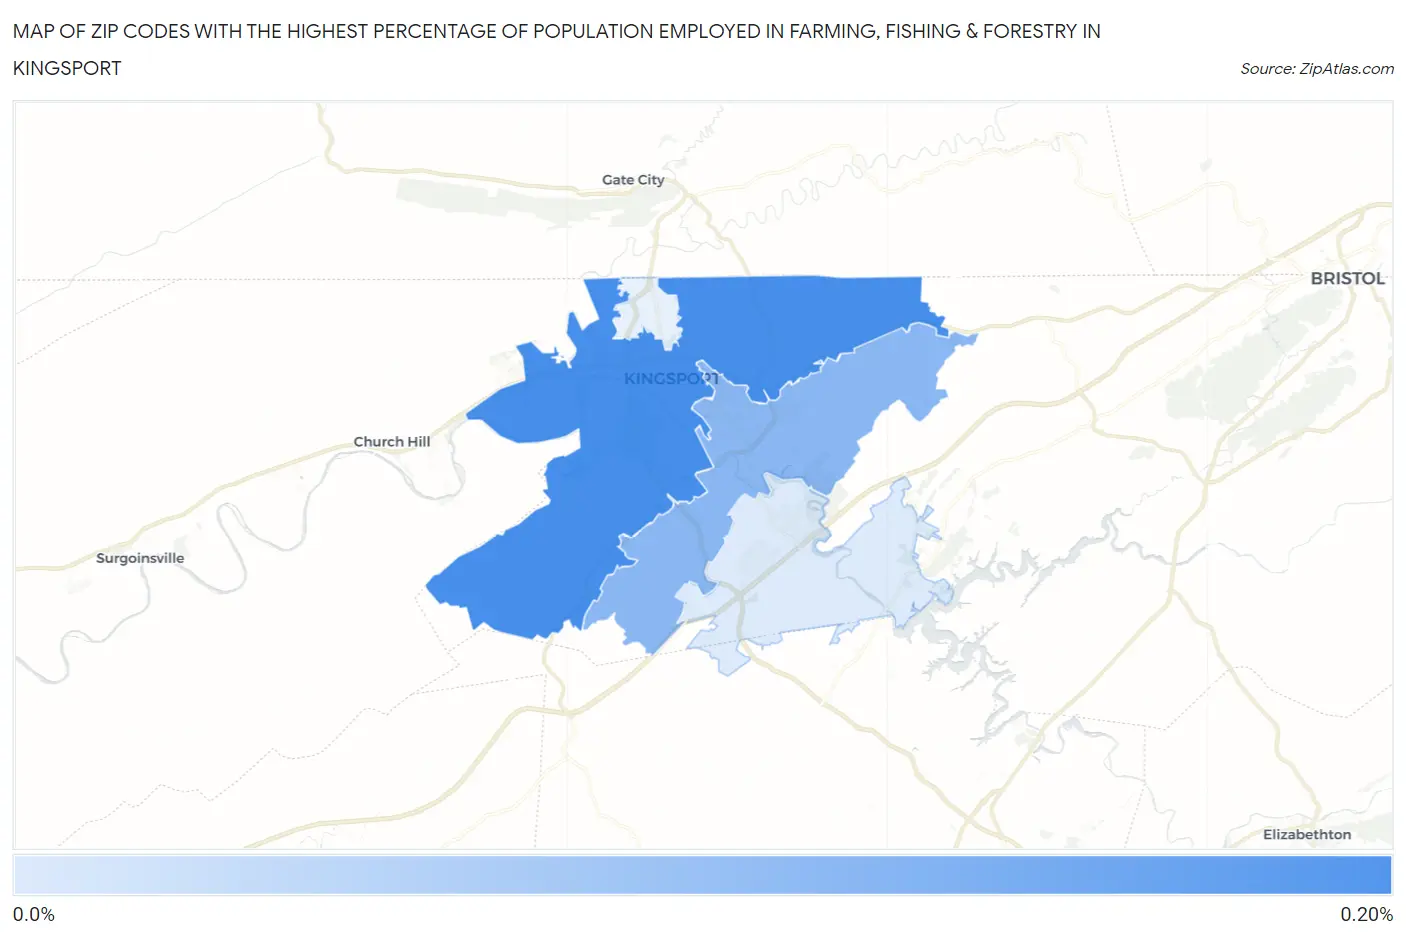
Map of Zip Codes with the Highest Percentage of Population Employed in Farming, Fishing & Forestry in Kingsport
0.0%
0.20%
Zip Codes with the Highest Percentage of Population Employed in Farming, Fishing & Forestry in Kingsport, TN
| Zip Code | % Employed | vs State | vs National | |
| 1. | 37660 | 0.15% | 0.36%(-0.208)#271 | 0.61%(-0.456)#16,911 |
| 2. | 37664 | 0.089% | 0.36%(-0.269)#295 | 0.61%(-0.517)#17,949 |
| 3. | 37663 | 0.015% | 0.36%(-0.343)#325 | 0.61%(-0.590)#19,114 |
1
Common Questions
What are the Top 3 Zip Codes with the Highest Percentage of Population Employed in Farming, Fishing & Forestry in Kingsport, TN?
Top 3 Zip Codes with the Highest Percentage of Population Employed in Farming, Fishing & Forestry in Kingsport, TN are:
What zip code has the Highest Percentage of Population Employed in Farming, Fishing & Forestry in Kingsport, TN?
37660 has the Highest Percentage of Population Employed in Farming, Fishing & Forestry in Kingsport, TN with 0.15%.
What is the Percentage of Population Employed in Farming, Fishing & Forestry in Kingsport, TN?
Percentage of Population Employed in Farming, Fishing & Forestry in Kingsport is 0.052%.
What is the Percentage of Population Employed in Farming, Fishing & Forestry in Tennessee?
Percentage of Population Employed in Farming, Fishing & Forestry in Tennessee is 0.36%.
What is the Percentage of Population Employed in Farming, Fishing & Forestry in the United States?
Percentage of Population Employed in Farming, Fishing & Forestry in the United States is 0.61%.