Zip Codes with the Highest Percentage of Households Heated by Bottled Gas / Liquid Propane in Johnson City, TN
RELATED REPORTS & OPTIONS
Bottled Gas / LP Heating
Johnson City
Compare Zip Codes
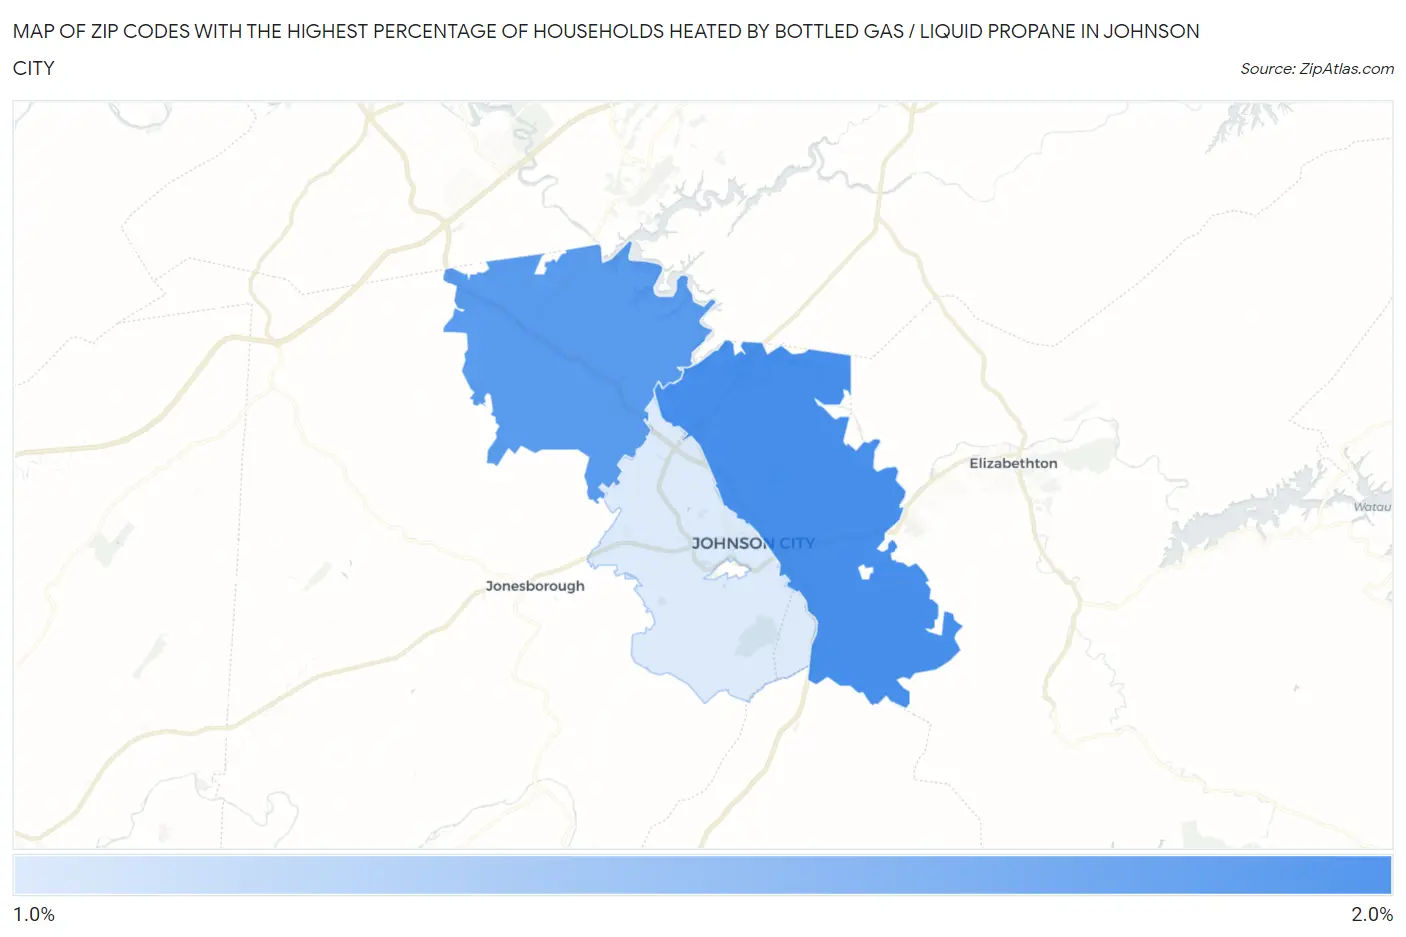
Map of Zip Codes with the Highest Percentage of Households Heated by Bottled Gas / Liquid Propane in Johnson City
0.0%
2.0%
Zip Codes with the Highest Percentage of Households Heated by Bottled Gas / Liquid Propane in Johnson City, TN
| Zip Code | Bottled Gas / LP Heating | vs State | vs National | |
| 1. | 37601 | 1.9% | 3.6%(-1.70)#456 | 4.9%(-3.00)#23,427 |
| 2. | 37615 | 1.8% | 3.6%(-1.80)#463 | 4.9%(-3.10)#23,779 |
| 3. | 37604 | 1.0% | 3.6%(-2.60)#522 | 4.9%(-3.90)#26,603 |
1
Common Questions
What are the Top Zip Codes with the Highest Percentage of Households Heated by Bottled Gas / Liquid Propane in Johnson City, TN?
Top Zip Codes with the Highest Percentage of Households Heated by Bottled Gas / Liquid Propane in Johnson City, TN are:
What zip code has the Highest Percentage of Households Heated by Bottled Gas / Liquid Propane in Johnson City, TN?
37601 has the Highest Percentage of Households Heated by Bottled Gas / Liquid Propane in Johnson City, TN with 1.9%.
What is the Percentage of Households Heated by Bottled Gas / Liquid Propane in Johnson City, TN?
Percentage of Households Heated by Bottled Gas / Liquid Propane in Johnson City is 0.90%.
What is the Percentage of Households Heated by Bottled Gas / Liquid Propane in Tennessee?
Percentage of Households Heated by Bottled Gas / Liquid Propane in Tennessee is 3.6%.
What is the Percentage of Households Heated by Bottled Gas / Liquid Propane in the United States?
Percentage of Households Heated by Bottled Gas / Liquid Propane in the United States is 4.9%.