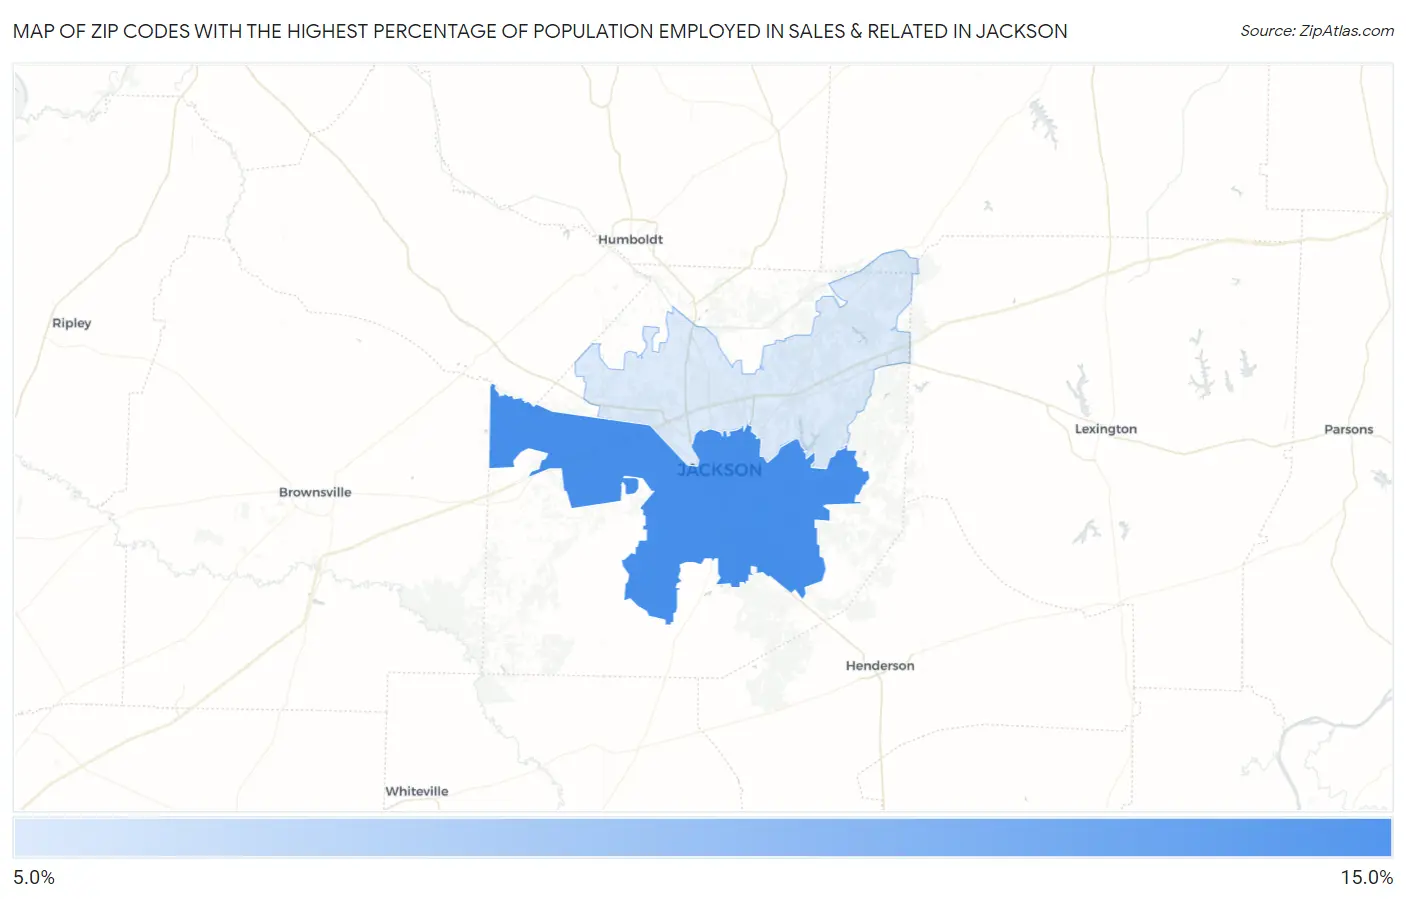
Zip Codes with the Highest Percentage of Population Employed in Sales & Related in Jackson, TN
RELATED REPORTS & OPTIONS
Sales & Related
Jackson
Compare Zip Codes
Map of Zip Codes with the Highest Percentage of Population Employed in Sales & Related in Jackson
9.7%
12.2%
Zip Codes with the Highest Percentage of Population Employed in Sales & Related in Jackson, TN
| Zip Code | % Employed | vs State | vs National | |
| 1. | 38301 | 12.2% | 9.8%(+2.32)#105 | 9.6%(+2.56)#5,747 |
| 2. | 38305 | 9.7% | 9.8%(-0.158)#240 | 9.6%(+0.080)#12,130 |
1
Common Questions
What are the Top Zip Codes with the Highest Percentage of Population Employed in Sales & Related in Jackson, TN?
Top Zip Codes with the Highest Percentage of Population Employed in Sales & Related in Jackson, TN are:
What zip code has the Highest Percentage of Population Employed in Sales & Related in Jackson, TN?
38301 has the Highest Percentage of Population Employed in Sales & Related in Jackson, TN with 12.2%.
What is the Percentage of Population Employed in Sales & Related in Jackson, TN?
Percentage of Population Employed in Sales & Related in Jackson is 11.3%.
What is the Percentage of Population Employed in Sales & Related in Tennessee?
Percentage of Population Employed in Sales & Related in Tennessee is 9.8%.
What is the Percentage of Population Employed in Sales & Related in the United States?
Percentage of Population Employed in Sales & Related in the United States is 9.6%.