Zip Codes with the Highest Percentage of Population Employed in Professional & Scientific Services in Jackson, TN
RELATED REPORTS & OPTIONS
Professional & Scientific Services
Jackson
Compare Zip Codes
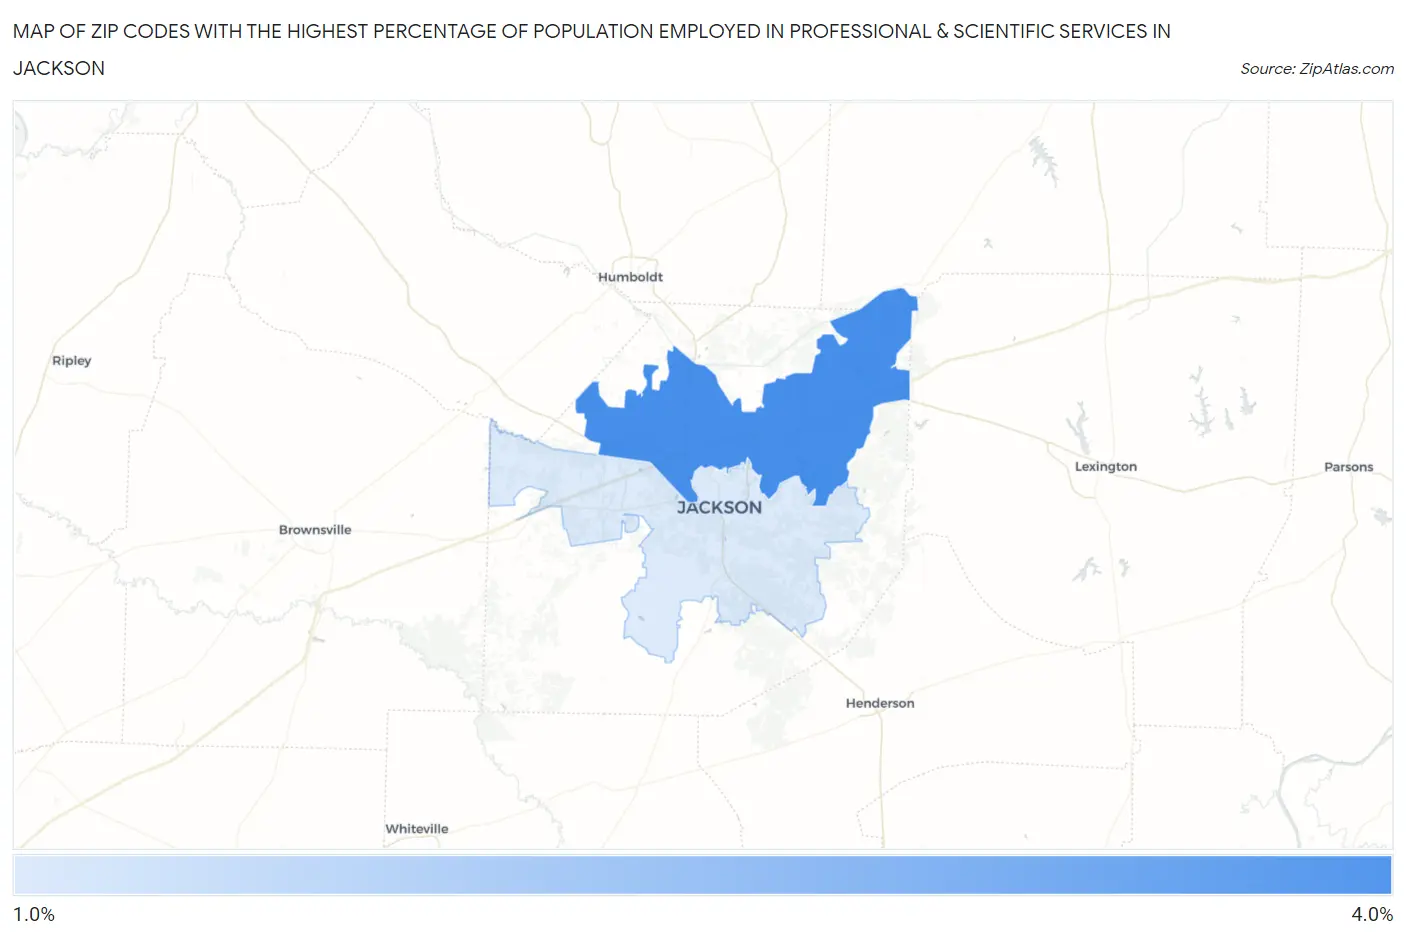
Map of Zip Codes with the Highest Percentage of Population Employed in Professional & Scientific Services in Jackson
1.8%
3.2%
Zip Codes with the Highest Percentage of Population Employed in Professional & Scientific Services in Jackson, TN
| Zip Code | % Employed | vs State | vs National | |
| 1. | 38305 | 3.2% | 5.7%(-2.53)#306 | 7.8%(-4.65)#17,737 |
| 2. | 38301 | 1.8% | 5.7%(-3.89)#418 | 7.8%(-6.01)#22,425 |
1
Common Questions
What are the Top Zip Codes with the Highest Percentage of Population Employed in Professional & Scientific Services in Jackson, TN?
Top Zip Codes with the Highest Percentage of Population Employed in Professional & Scientific Services in Jackson, TN are:
What zip code has the Highest Percentage of Population Employed in Professional & Scientific Services in Jackson, TN?
38305 has the Highest Percentage of Population Employed in Professional & Scientific Services in Jackson, TN with 3.2%.
What is the Percentage of Population Employed in Professional & Scientific Services in Jackson, TN?
Percentage of Population Employed in Professional & Scientific Services in Jackson is 3.0%.
What is the Percentage of Population Employed in Professional & Scientific Services in Tennessee?
Percentage of Population Employed in Professional & Scientific Services in Tennessee is 5.7%.
What is the Percentage of Population Employed in Professional & Scientific Services in the United States?
Percentage of Population Employed in Professional & Scientific Services in the United States is 7.8%.