Zip Codes with the Highest Percentage of Population Employed in Sales & Related in Greeneville, TN
RELATED REPORTS & OPTIONS
Sales & Related
Greeneville
Compare Zip Codes
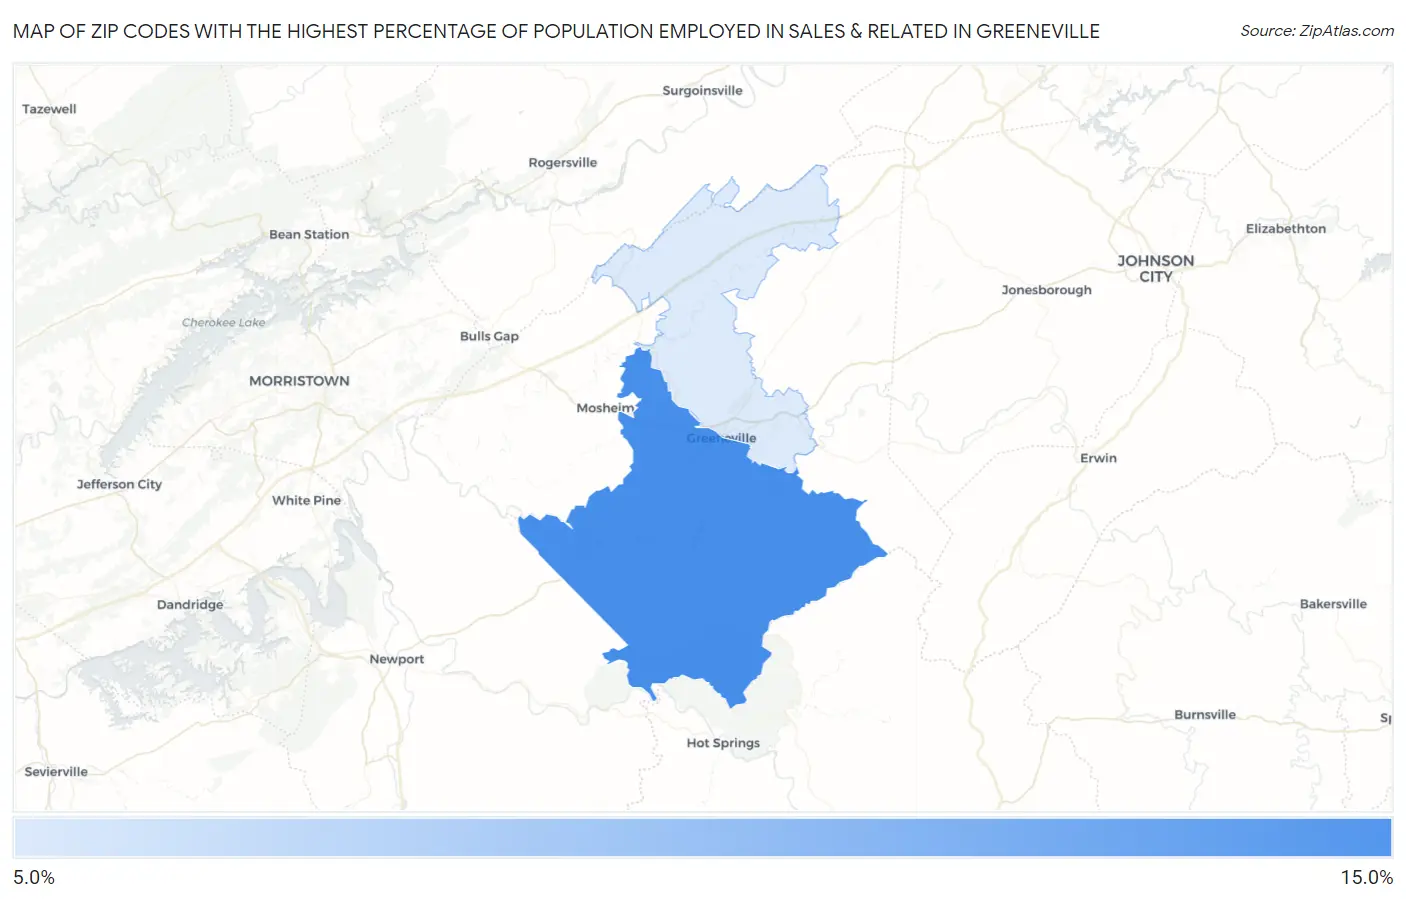
Map of Zip Codes with the Highest Percentage of Population Employed in Sales & Related in Greeneville
9.9%
11.0%
Zip Codes with the Highest Percentage of Population Employed in Sales & Related in Greeneville, TN
| Zip Code | % Employed | vs State | vs National | |
| 1. | 37743 | 11.0% | 9.8%(+1.21)#157 | 9.6%(+1.45)#8,087 |
| 2. | 37745 | 9.9% | 9.8%(+0.054)#225 | 9.6%(+0.292)#11,367 |
1
Common Questions
What are the Top Zip Codes with the Highest Percentage of Population Employed in Sales & Related in Greeneville, TN?
Top Zip Codes with the Highest Percentage of Population Employed in Sales & Related in Greeneville, TN are:
What zip code has the Highest Percentage of Population Employed in Sales & Related in Greeneville, TN?
37743 has the Highest Percentage of Population Employed in Sales & Related in Greeneville, TN with 11.0%.
What is the Percentage of Population Employed in Sales & Related in Greeneville, TN?
Percentage of Population Employed in Sales & Related in Greeneville is 15.6%.
What is the Percentage of Population Employed in Sales & Related in Tennessee?
Percentage of Population Employed in Sales & Related in Tennessee is 9.8%.
What is the Percentage of Population Employed in Sales & Related in the United States?
Percentage of Population Employed in Sales & Related in the United States is 9.6%.