Zip Codes with the Highest Percentage of Population Employed in Transportation in Crossville, TN
RELATED REPORTS & OPTIONS
Transportation
Crossville
Compare Zip Codes
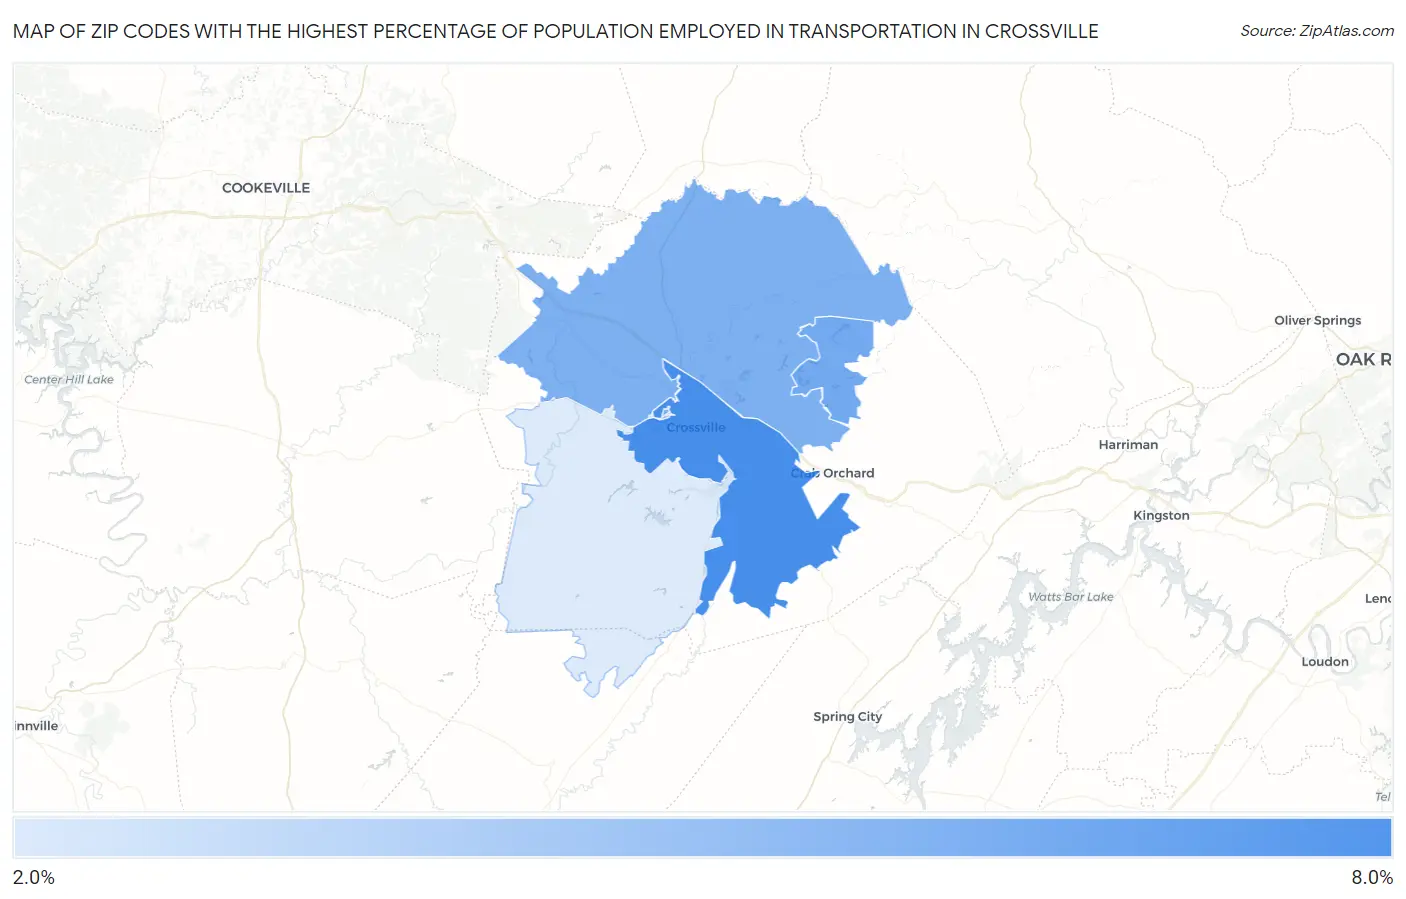
Map of Zip Codes with the Highest Percentage of Population Employed in Transportation in Crossville
0.0%
8.0%
Zip Codes with the Highest Percentage of Population Employed in Transportation in Crossville, TN
| Zip Code | % Employed | vs State | vs National | |
| 1. | 38555 | 6.2% | 4.0%(+2.18)#131 | 3.8%(+2.34)#6,999 |
| 2. | 38558 | 5.2% | 4.0%(+1.20)#186 | 3.8%(+1.36)#9,773 |
| 3. | 38571 | 5.0% | 4.0%(+1.01)#203 | 3.8%(+1.17)#10,345 |
| 4. | 38572 | 2.9% | 4.0%(-1.11)#427 | 3.8%(-0.953)#19,856 |
1
Common Questions
What are the Top 3 Zip Codes with the Highest Percentage of Population Employed in Transportation in Crossville, TN?
Top 3 Zip Codes with the Highest Percentage of Population Employed in Transportation in Crossville, TN are:
What zip code has the Highest Percentage of Population Employed in Transportation in Crossville, TN?
38555 has the Highest Percentage of Population Employed in Transportation in Crossville, TN with 6.2%.
What is the Percentage of Population Employed in Transportation in Crossville, TN?
Percentage of Population Employed in Transportation in Crossville is 5.6%.
What is the Percentage of Population Employed in Transportation in Tennessee?
Percentage of Population Employed in Transportation in Tennessee is 4.0%.
What is the Percentage of Population Employed in Transportation in the United States?
Percentage of Population Employed in Transportation in the United States is 3.8%.