Zip Codes with the Highest Percentage of Population Employed in Manufacturing in Crossville, TN
RELATED REPORTS & OPTIONS
Manufacturing
Crossville
Compare Zip Codes
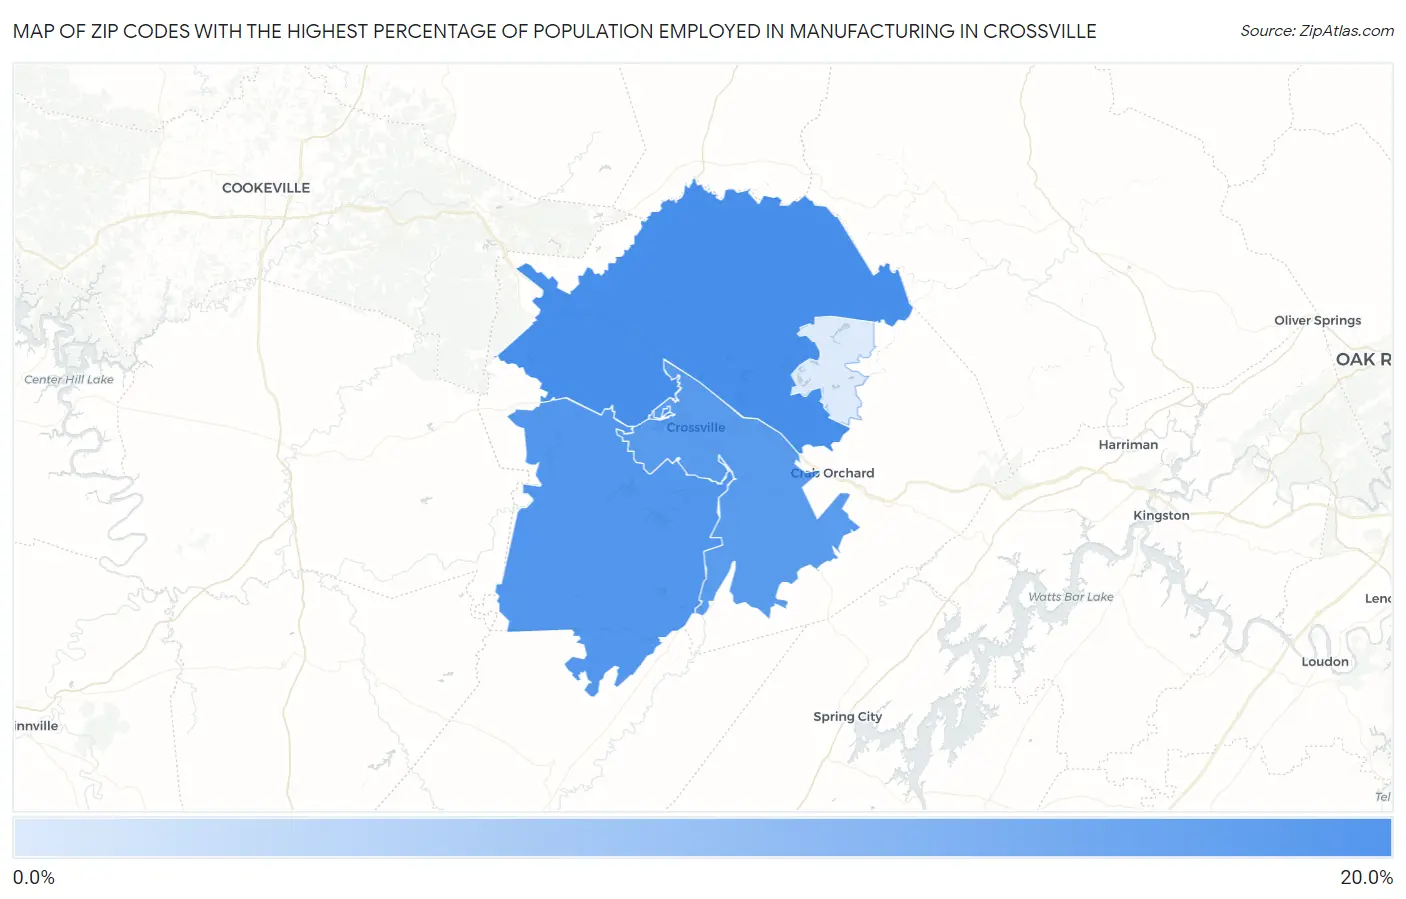
Map of Zip Codes with the Highest Percentage of Population Employed in Manufacturing in Crossville
0.0%
20.0%
Zip Codes with the Highest Percentage of Population Employed in Manufacturing in Crossville, TN
| Zip Code | % Employed | vs State | vs National | |
| 1. | 38571 | 17.2% | 12.9%(+4.31)#264 | 10.0%(+7.25)#6,919 |
| 2. | 38572 | 16.3% | 12.9%(+3.41)#287 | 10.0%(+6.35)#7,704 |
| 3. | 38555 | 16.1% | 12.9%(+3.14)#297 | 10.0%(+6.08)#7,947 |
| 4. | 38558 | 6.7% | 12.9%(-6.28)#556 | 10.0%(-3.34)#21,598 |
1
Common Questions
What are the Top 3 Zip Codes with the Highest Percentage of Population Employed in Manufacturing in Crossville, TN?
Top 3 Zip Codes with the Highest Percentage of Population Employed in Manufacturing in Crossville, TN are:
What zip code has the Highest Percentage of Population Employed in Manufacturing in Crossville, TN?
38571 has the Highest Percentage of Population Employed in Manufacturing in Crossville, TN with 17.2%.
What is the Percentage of Population Employed in Manufacturing in Crossville, TN?
Percentage of Population Employed in Manufacturing in Crossville is 19.1%.
What is the Percentage of Population Employed in Manufacturing in Tennessee?
Percentage of Population Employed in Manufacturing in Tennessee is 12.9%.
What is the Percentage of Population Employed in Manufacturing in the United States?
Percentage of Population Employed in Manufacturing in the United States is 10.0%.