Zip Codes with the Highest Percentage of Owner-Occupied Units in Crossville, TN
RELATED REPORTS & OPTIONS
Highest Owner-Occupied
Crossville
Compare Zip Codes
Map of Zip Codes with the Highest Percentage of Owner-Occupied Units in Crossville
0.0%
100.0%
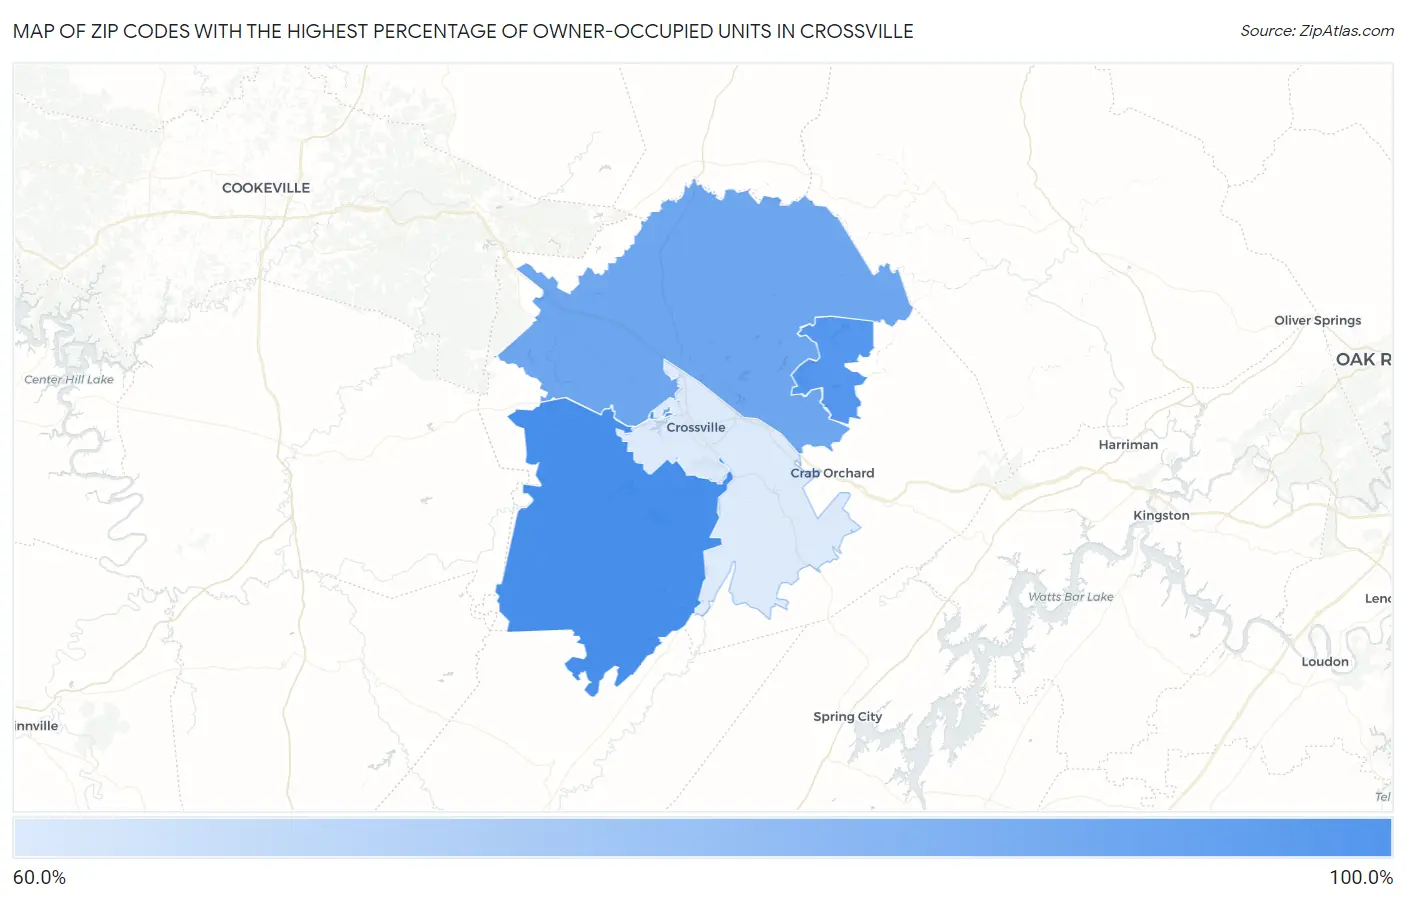
Zip Codes with the Highest Percentage of Owner-Occupied Units in Crossville, TN
| Zip Code | % Owner-Occupied | vs State | vs National | |
| 1. | 38572 | 91.2% | 67.1%(+24.2)#59 | 64.8%(+26.4)#4,676 |
| 2. | 38558 | 88.6% | 67.1%(+21.6)#89 | 64.8%(+23.8)#6,515 |
| 3. | 38571 | 83.6% | 67.1%(+16.5)#170 | 64.8%(+18.7)#11,107 |
| 4. | 38555 | 63.2% | 67.1%(-3.86)#505 | 64.8%(-1.62)#26,247 |
1
Common Questions
What are the Top 3 Zip Codes with the Highest Percentage of Owner-Occupied Units in Crossville, TN?
Top 3 Zip Codes with the Highest Percentage of Owner-Occupied Units in Crossville, TN are:
What zip code has the Highest Percentage of Owner-Occupied Units in Crossville, TN?
38572 has the Highest Percentage of Owner-Occupied Units in Crossville, TN with 91.2%.
What is the Percentage of Owner-Occupied Units in Crossville, TN?
Percentage of Owner-Occupied Units in Crossville is 50.5%.
What is the Percentage of Owner-Occupied Units in Tennessee?
Percentage of Owner-Occupied Units in Tennessee is 67.1%.
What is the Percentage of Owner-Occupied Units in the United States?
Percentage of Owner-Occupied Units in the United States is 64.8%.