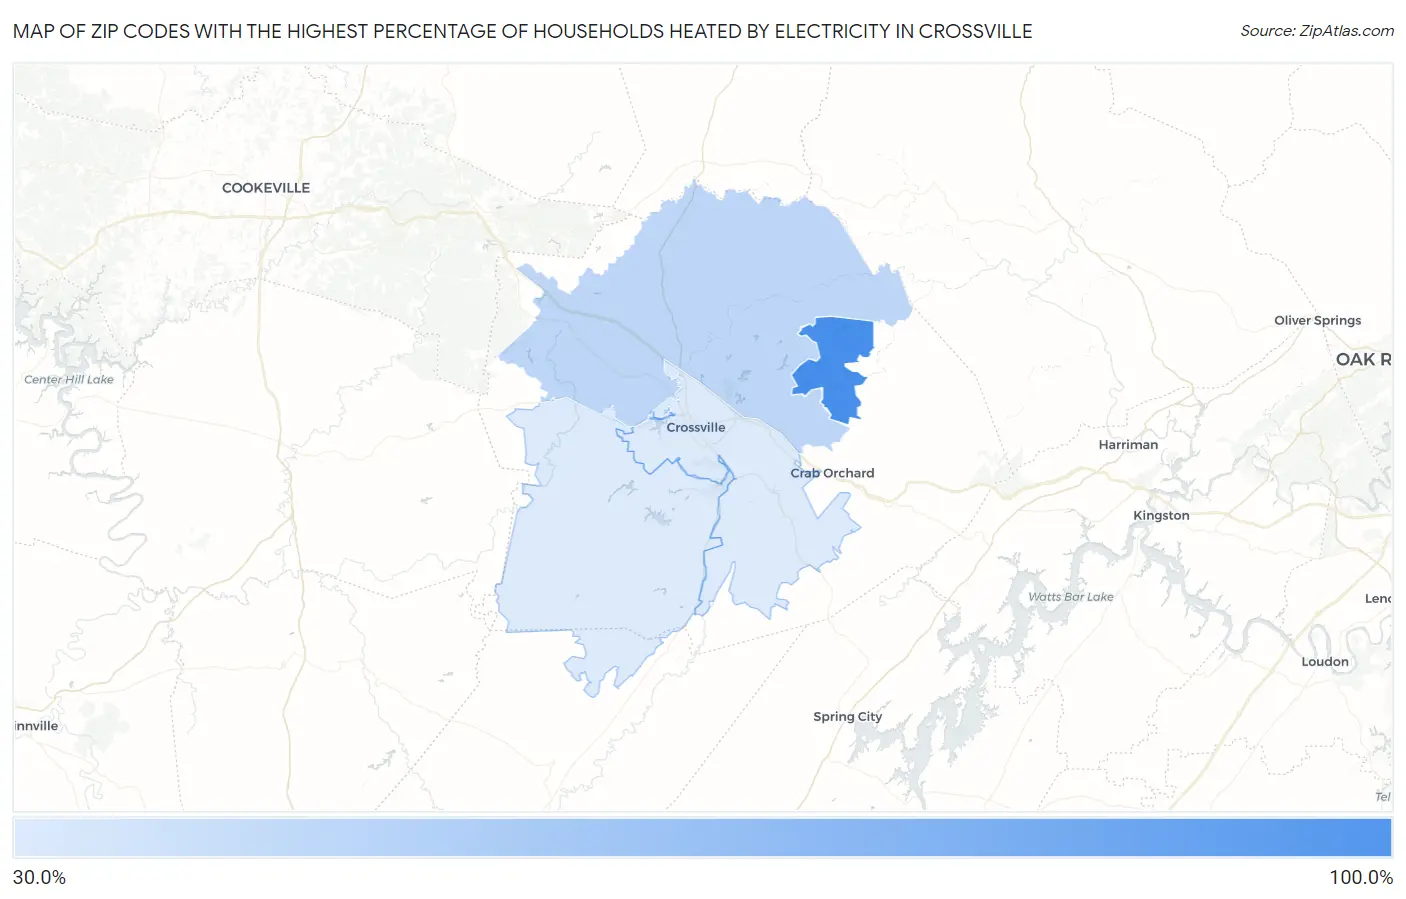
Zip Codes with the Highest Percentage of Households Heated by Electricity in Crossville, TN
RELATED REPORTS & OPTIONS
Electrical Heating
Crossville
Compare Zip Codes
Map of Zip Codes with the Highest Percentage of Households Heated by Electricity in Crossville
0.0%
100.0%
Zip Codes with the Highest Percentage of Households Heated by Electricity in Crossville, TN
| Zip Code | Electrical Heating | vs State | vs National | |
| 1. | 38558 | 80.1% | 62.9%(+17.2)#100 | 40.2%(+39.9)#3,039 |
| 2. | 38571 | 47.5% | 62.9%(-15.4)#474 | 40.2%(+7.30)#10,605 |
| 3. | 38555 | 39.5% | 62.9%(-23.4)#533 | 40.2%(-0.700)#12,830 |
| 4. | 38572 | 39.3% | 62.9%(-23.6)#537 | 40.2%(-0.900)#12,887 |
1
Common Questions
What are the Top 3 Zip Codes with the Highest Percentage of Households Heated by Electricity in Crossville, TN?
Top 3 Zip Codes with the Highest Percentage of Households Heated by Electricity in Crossville, TN are:
What zip code has the Highest Percentage of Households Heated by Electricity in Crossville, TN?
38558 has the Highest Percentage of Households Heated by Electricity in Crossville, TN with 80.1%.
What is the Percentage of Households Heated by Electricity in Crossville, TN?
Percentage of Households Heated by Electricity in Crossville is 53.1%.
What is the Percentage of Households Heated by Electricity in Tennessee?
Percentage of Households Heated by Electricity in Tennessee is 62.9%.
What is the Percentage of Households Heated by Electricity in the United States?
Percentage of Households Heated by Electricity in the United States is 40.2%.