Zip Codes with the Highest Percentage of Households Heated by Bottled Gas / Liquid Propane in Crossville, TN
RELATED REPORTS & OPTIONS
Bottled Gas / LP Heating
Crossville
Compare Zip Codes
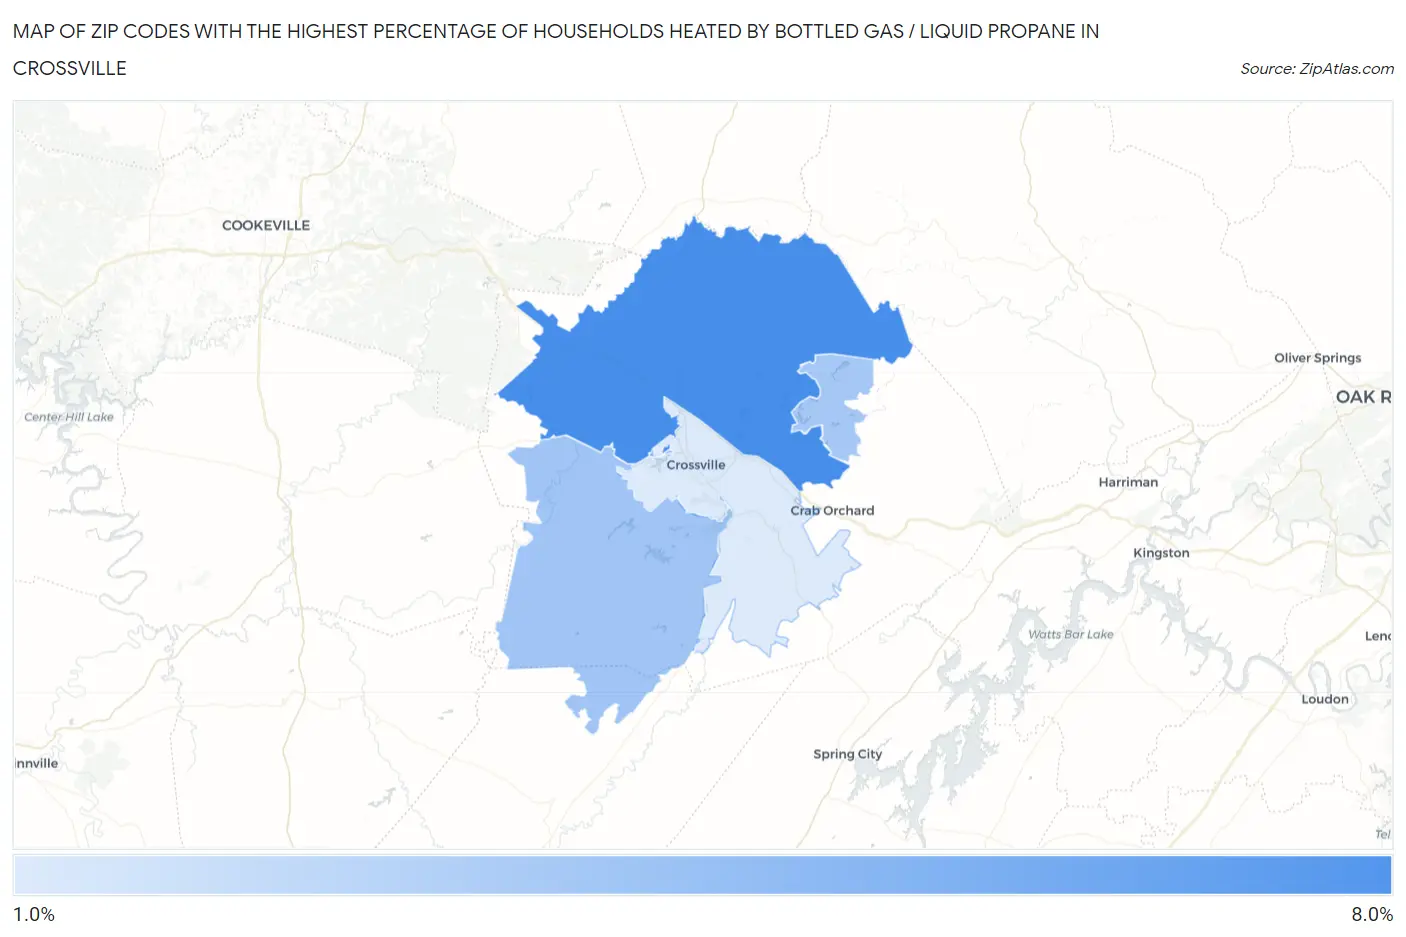
Map of Zip Codes with the Highest Percentage of Households Heated by Bottled Gas / Liquid Propane in Crossville
0.0%
8.0%
Zip Codes with the Highest Percentage of Households Heated by Bottled Gas / Liquid Propane in Crossville, TN
| Zip Code | Bottled Gas / LP Heating | vs State | vs National | |
| 1. | 38571 | 7.8% | 3.6%(+4.20)#220 | 4.9%(+2.90)#16,089 |
| 2. | 38572 | 4.2% | 3.6%(+0.600)#348 | 4.9%(-0.700)#19,437 |
| 3. | 38558 | 4.0% | 3.6%(+0.400)#359 | 4.9%(-0.900)#19,652 |
| 4. | 38555 | 1.9% | 3.6%(-1.70)#459 | 4.9%(-3.00)#23,503 |
1
Common Questions
What are the Top 3 Zip Codes with the Highest Percentage of Households Heated by Bottled Gas / Liquid Propane in Crossville, TN?
Top 3 Zip Codes with the Highest Percentage of Households Heated by Bottled Gas / Liquid Propane in Crossville, TN are:
What zip code has the Highest Percentage of Households Heated by Bottled Gas / Liquid Propane in Crossville, TN?
38571 has the Highest Percentage of Households Heated by Bottled Gas / Liquid Propane in Crossville, TN with 7.8%.
What is the Percentage of Households Heated by Bottled Gas / Liquid Propane in Crossville, TN?
Percentage of Households Heated by Bottled Gas / Liquid Propane in Crossville is 1.0%.
What is the Percentage of Households Heated by Bottled Gas / Liquid Propane in Tennessee?
Percentage of Households Heated by Bottled Gas / Liquid Propane in Tennessee is 3.6%.
What is the Percentage of Households Heated by Bottled Gas / Liquid Propane in the United States?
Percentage of Households Heated by Bottled Gas / Liquid Propane in the United States is 4.9%.