Zip Codes with the Highest Percentage of Hispanic or Latino Population in Crossville, TN
RELATED REPORTS & OPTIONS
Hispanic or Latino
Crossville
Compare Zip Codes
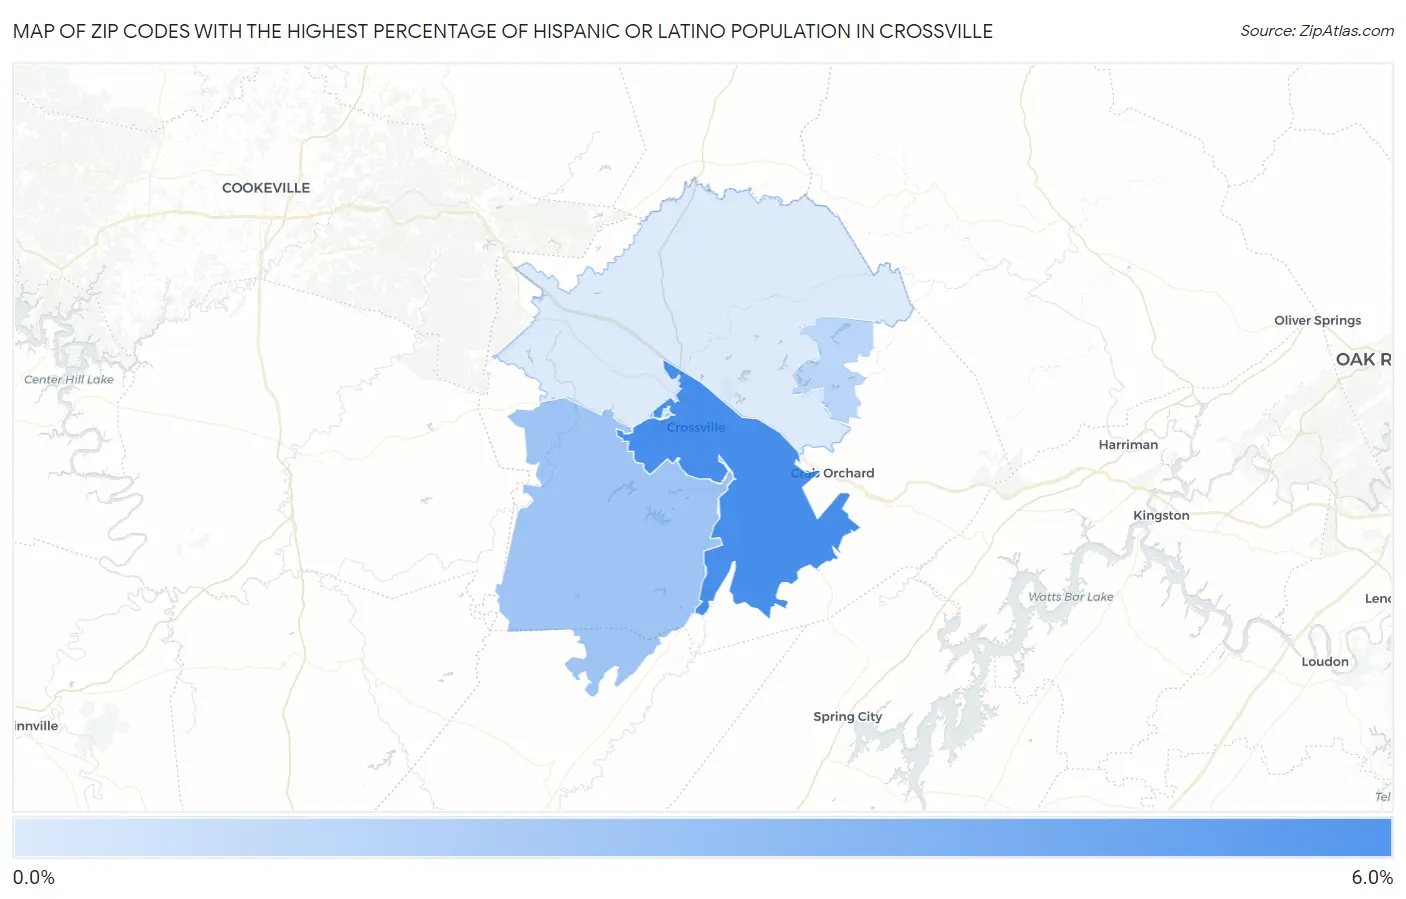
Map of Zip Codes with the Highest Percentage of Hispanic or Latino Population in Crossville
1.0%
5.9%
Zip Codes with the Highest Percentage of Hispanic or Latino Population in Crossville, TN
| Zip Code | Hispanic or Latino | vs State | vs National | |
| 1. | 38555 | 5.9% | 6.0%(-0.087)#123 | 18.7%(-12.8)#12,974 |
| 2. | 38572 | 3.0% | 6.0%(-2.96)#283 | 18.7%(-15.7)#18,381 |
| 3. | 38558 | 2.1% | 6.0%(-3.83)#352 | 18.7%(-16.5)#20,646 |
| 4. | 38571 | 1.0% | 6.0%(-4.95)#449 | 18.7%(-17.6)#24,063 |
1
Common Questions
What are the Top 3 Zip Codes with the Highest Percentage of Hispanic or Latino Population in Crossville, TN?
Top 3 Zip Codes with the Highest Percentage of Hispanic or Latino Population in Crossville, TN are:
What zip code has the Highest Percentage of Hispanic or Latino Population in Crossville, TN?
38555 has the Highest Percentage of Hispanic or Latino Population in Crossville, TN with 5.9%.
What is the Percentage of Hispanic or Latino Population in Crossville, TN?
Percentage of Hispanic or Latino Population in Crossville is 9.0%.
What is the Percentage of Hispanic or Latino Population in Tennessee?
Percentage of Hispanic or Latino Population in Tennessee is 6.0%.
What is the Percentage of Hispanic or Latino Population in the United States?
Percentage of Hispanic or Latino Population in the United States is 18.7%.