Zip Codes with the Highest Percentage of Population Employed in Farming, Fishing & Forestry in Crossville, TN
RELATED REPORTS & OPTIONS
Farming, Fishing & Forestry
Crossville
Compare Zip Codes
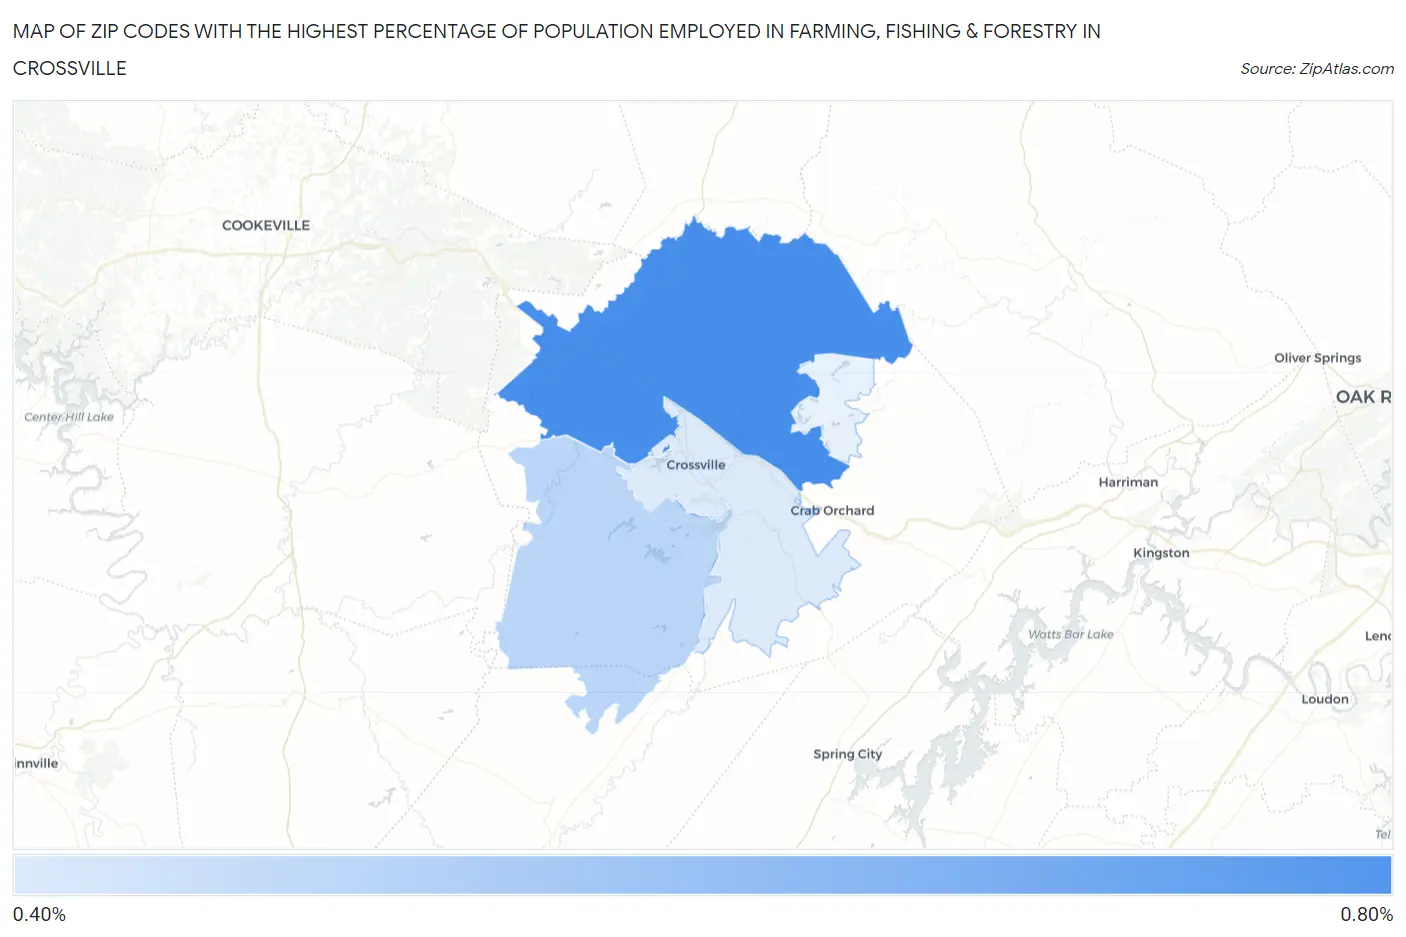
Map of Zip Codes with the Highest Percentage of Population Employed in Farming, Fishing & Forestry in Crossville
0.0%
0.80%
Zip Codes with the Highest Percentage of Population Employed in Farming, Fishing & Forestry in Crossville, TN
| Zip Code | % Employed | vs State | vs National | |
| 1. | 38571 | 0.76% | 0.36%(+0.400)#160 | 0.61%(+0.152)#11,039 |
| 2. | 38572 | 0.50% | 0.36%(+0.142)#182 | 0.61%(-0.106)#12,834 |
| 3. | 38555 | 0.42% | 0.36%(+0.065)#197 | 0.61%(-0.183)#13,565 |
1
Common Questions
What are the Top 3 Zip Codes with the Highest Percentage of Population Employed in Farming, Fishing & Forestry in Crossville, TN?
Top 3 Zip Codes with the Highest Percentage of Population Employed in Farming, Fishing & Forestry in Crossville, TN are:
What zip code has the Highest Percentage of Population Employed in Farming, Fishing & Forestry in Crossville, TN?
38571 has the Highest Percentage of Population Employed in Farming, Fishing & Forestry in Crossville, TN with 0.76%.
What is the Percentage of Population Employed in Farming, Fishing & Forestry in Crossville, TN?
Percentage of Population Employed in Farming, Fishing & Forestry in Crossville is 0.55%.
What is the Percentage of Population Employed in Farming, Fishing & Forestry in Tennessee?
Percentage of Population Employed in Farming, Fishing & Forestry in Tennessee is 0.36%.
What is the Percentage of Population Employed in Farming, Fishing & Forestry in the United States?
Percentage of Population Employed in Farming, Fishing & Forestry in the United States is 0.61%.