Zip Codes with the Highest Percentage of Population Employed in Agriculture, Fishing & Hunting in Cleveland, TN
RELATED REPORTS & OPTIONS
Agriculture, Fishing & Hunting
Cleveland
Compare Zip Codes
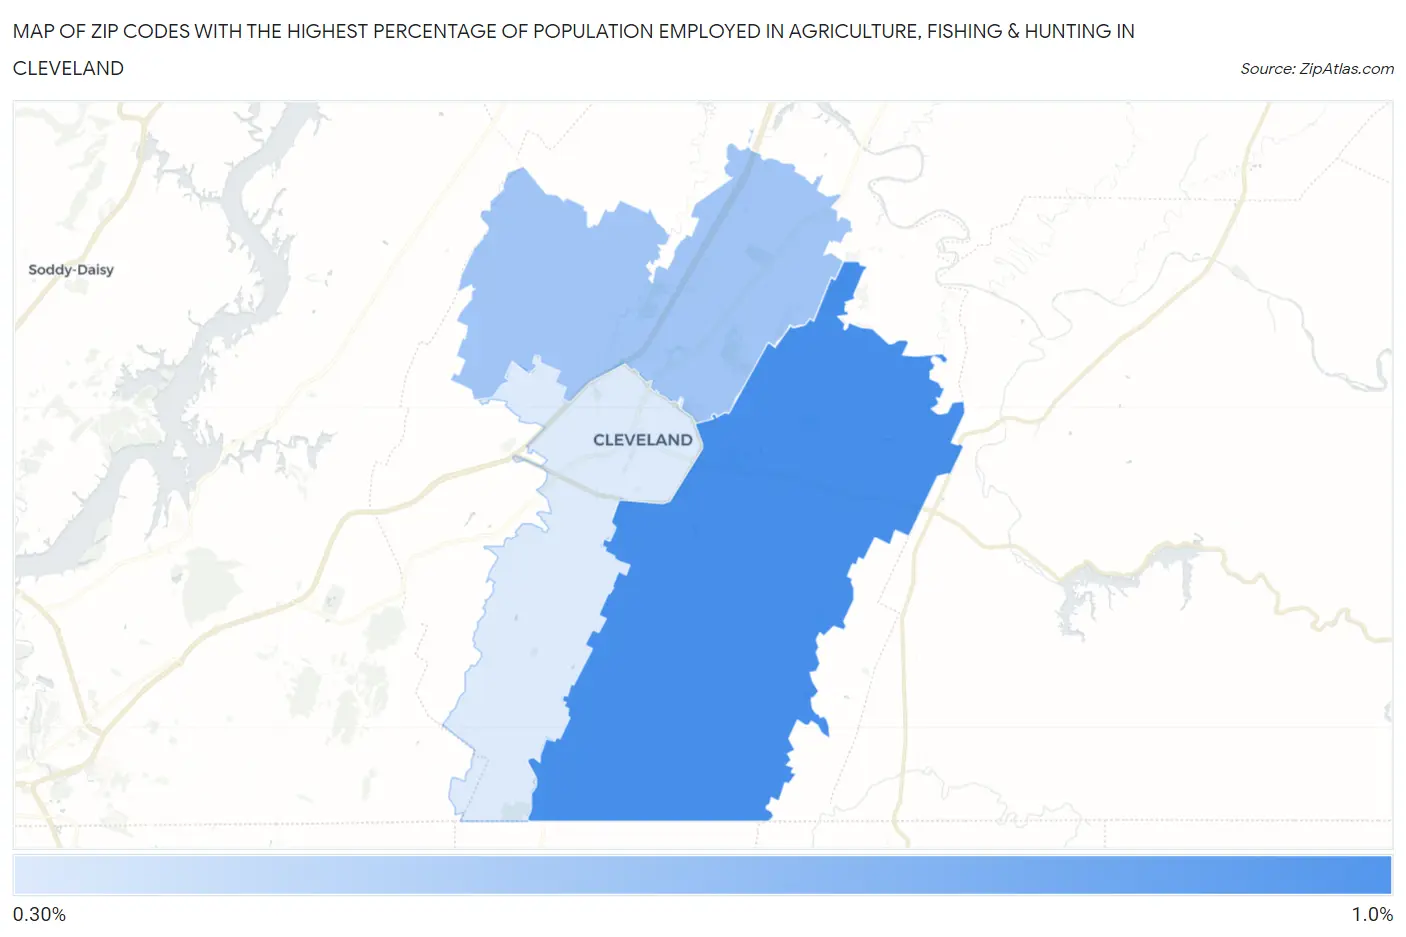
Map of Zip Codes with the Highest Percentage of Population Employed in Agriculture, Fishing & Hunting in Cleveland
0.0%
1.0%
Zip Codes with the Highest Percentage of Population Employed in Agriculture, Fishing & Hunting in Cleveland, TN
| Zip Code | % Employed | vs State | vs National | |
| 1. | 37323 | 0.83% | 0.74%(+0.090)#278 | 1.2%(-0.373)#17,095 |
| 2. | 37312 | 0.53% | 0.74%(-0.204)#320 | 1.2%(-0.667)#18,992 |
| 3. | 37311 | 0.34% | 0.74%(-0.397)#368 | 1.2%(-0.860)#20,751 |
1
Common Questions
What are the Top Zip Codes with the Highest Percentage of Population Employed in Agriculture, Fishing & Hunting in Cleveland, TN?
Top Zip Codes with the Highest Percentage of Population Employed in Agriculture, Fishing & Hunting in Cleveland, TN are:
What zip code has the Highest Percentage of Population Employed in Agriculture, Fishing & Hunting in Cleveland, TN?
37323 has the Highest Percentage of Population Employed in Agriculture, Fishing & Hunting in Cleveland, TN with 0.83%.
What is the Percentage of Population Employed in Agriculture, Fishing & Hunting in Cleveland, TN?
Percentage of Population Employed in Agriculture, Fishing & Hunting in Cleveland is 0.15%.
What is the Percentage of Population Employed in Agriculture, Fishing & Hunting in Tennessee?
Percentage of Population Employed in Agriculture, Fishing & Hunting in Tennessee is 0.74%.
What is the Percentage of Population Employed in Agriculture, Fishing & Hunting in the United States?
Percentage of Population Employed in Agriculture, Fishing & Hunting in the United States is 1.2%.